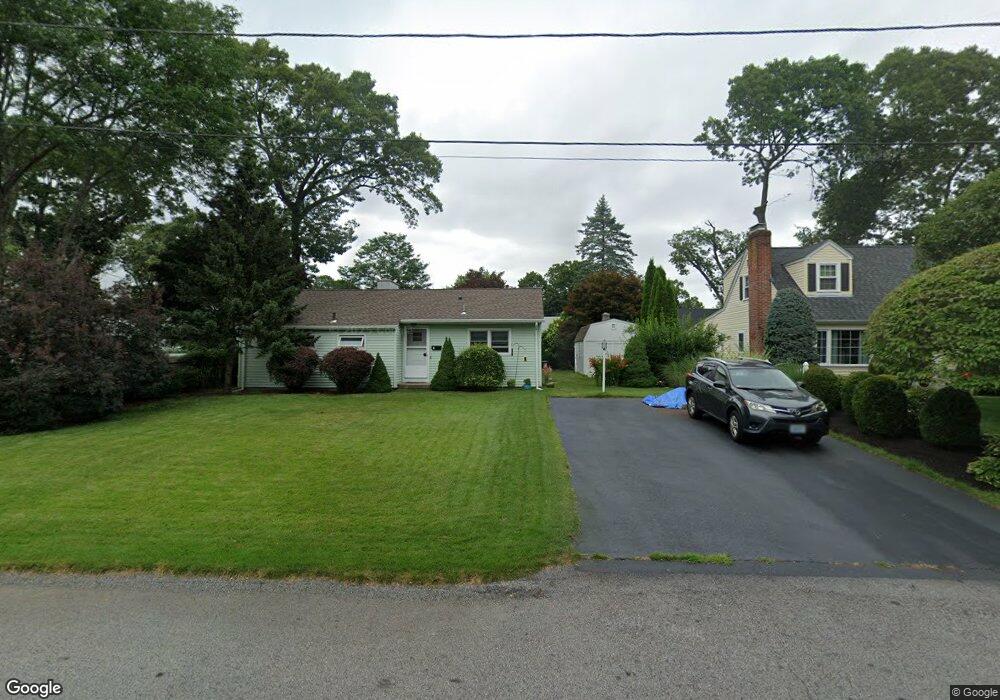
7 Cross St Warwick, RI 02888
Lakewood NeighborhoodEstimated Value: $348,140 - $391,000
2
Beds
1
Bath
1,216
Sq Ft
$303/Sq Ft
Est. Value
About This Home
This home is located at 7 Cross St, Warwick, RI 02888 and is currently estimated at $368,035, approximately $302 per square foot. 7 Cross St is a home located in Kent County with nearby schools including St. Peter School and Saint Paul School.
Ownership History
Date
Name
Owned For
Owner Type
Purchase Details
Closed on
Apr 25, 2001
Sold by
Campo Joseph D and Campo Robin D
Bought by
Hutchinson Sherly D
Current Estimated Value
Home Financials for this Owner
Home Financials are based on the most recent Mortgage that was taken out on this home.
Original Mortgage
$117,000
Outstanding Balance
$42,157
Interest Rate
6.88%
Mortgage Type
Purchase Money Mortgage
Estimated Equity
$325,878
Purchase Details
Closed on
Dec 1, 1993
Sold by
Thacker Leslie A and Sullivan Elizabeth A
Bought by
Campo Joseph D and Poulin Robin J
Home Financials for this Owner
Home Financials are based on the most recent Mortgage that was taken out on this home.
Original Mortgage
$76,900
Interest Rate
6.69%
Mortgage Type
Purchase Money Mortgage
Create a Home Valuation Report for This Property
The Home Valuation Report is an in-depth analysis detailing your home's value as well as a comparison with similar homes in the area
Home Values in the Area
Average Home Value in this Area
Purchase History
| Date | Buyer | Sale Price | Title Company |
|---|---|---|---|
| Hutchinson Sherly D | $117,000 | -- | |
| Campo Joseph D | $81,000 | -- |
Source: Public Records
Mortgage History
| Date | Status | Borrower | Loan Amount |
|---|---|---|---|
| Open | Campo Joseph D | $117,000 | |
| Previous Owner | Campo Joseph D | $76,900 |
Source: Public Records
Tax History Compared to Growth
Tax History
| Year | Tax Paid | Tax Assessment Tax Assessment Total Assessment is a certain percentage of the fair market value that is determined by local assessors to be the total taxable value of land and additions on the property. | Land | Improvement |
|---|---|---|---|---|
| 2025 | $3,863 | $304,200 | $101,600 | $202,600 |
| 2024 | $3,646 | $252,000 | $88,300 | $163,700 |
| 2023 | $3,560 | $250,900 | $88,300 | $162,600 |
| 2022 | $3,355 | $179,100 | $57,400 | $121,700 |
| 2021 | $3,355 | $179,100 | $57,400 | $121,700 |
| 2020 | $3,355 | $179,100 | $57,400 | $121,700 |
| 2019 | $3,355 | $179,100 | $57,400 | $121,700 |
| 2018 | $2,825 | $135,800 | $57,400 | $78,400 |
| 2017 | $2,749 | $135,800 | $57,400 | $78,400 |
| 2016 | $2,749 | $135,800 | $57,400 | $78,400 |
| 2015 | $2,502 | $120,600 | $56,400 | $64,200 |
| 2014 | $2,419 | $120,600 | $56,400 | $64,200 |
| 2013 | $2,387 | $120,600 | $56,400 | $64,200 |
Source: Public Records
Map
Nearby Homes