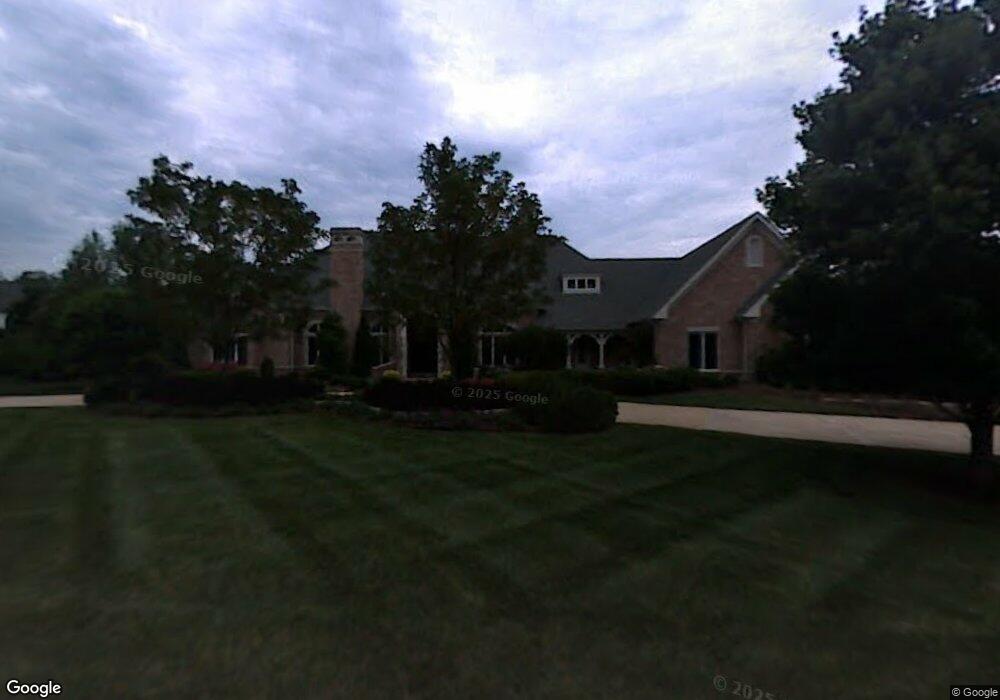
7 Lochinvar Dr Saint Louis, MO 63131
Estimated Value: $2,203,110 - $2,484,000
3
Beds
6
Baths
6,199
Sq Ft
$378/Sq Ft
Est. Value
About This Home
This home is located at 7 Lochinvar Dr, Saint Louis, MO 63131 and is currently estimated at $2,342,370, approximately $377 per square foot. 7 Lochinvar Dr is a home located in St. Louis County with nearby schools including Mason Ridge Elementary School, Parkway West Middle School, and Parkway West High School.
Ownership History
Date
Name
Owned For
Owner Type
Purchase Details
Closed on
Dec 20, 2022
Sold by
Nancy J Spencer Qualified Personal Resid and Spencer Nancy J
Bought by
Qprt No 2 and Gray
Current Estimated Value
Purchase Details
Closed on
Dec 7, 2021
Sold by
Nancy J Spencer Revocable Trust
Bought by
Nancy J Spencer Revocable Trust
Purchase Details
Closed on
Dec 26, 2006
Sold by
Sidener Isabelle J
Bought by
Nancy J Spencer Revocable Trust #2
Purchase Details
Closed on
Dec 20, 2006
Sold by
Nancy J Spencer Revocable Trust #2
Bought by
Nancy J Spencer Qualified Personal Resid
Purchase Details
Closed on
Aug 14, 1997
Sold by
Deshetler Homes Inc
Bought by
Spencer Nancy J and Nancy J Spencer Revocable Trust #2
Create a Home Valuation Report for This Property
The Home Valuation Report is an in-depth analysis detailing your home's value as well as a comparison with similar homes in the area
Home Values in the Area
Average Home Value in this Area
Purchase History
| Date | Buyer | Sale Price | Title Company |
|---|---|---|---|
| Qprt No 2 | -- | None Listed On Document | |
| Nancy J Spencer Revocable Trust | -- | Husch Blackwell Llp | |
| Nancy J Spencer Revocable Trust #2 | -- | None Available | |
| Nancy J Spencer Qualified Personal Resid | -- | None Available | |
| Nancy J Spencer Qualified Personal Resid | -- | None Available | |
| Spencer Nancy J | -- | -- | |
| Deshetler Homes Inc | -- | -- |
Source: Public Records
Tax History Compared to Growth
Tax History
| Year | Tax Paid | Tax Assessment Tax Assessment Total Assessment is a certain percentage of the fair market value that is determined by local assessors to be the total taxable value of land and additions on the property. | Land | Improvement |
|---|---|---|---|---|
| 2025 | $22,514 | $397,860 | $99,830 | $298,030 |
| 2024 | $22,514 | $387,010 | $88,730 | $298,280 |
| 2023 | $21,307 | $387,010 | $88,730 | $298,280 |
| 2022 | $19,348 | $319,360 | $99,830 | $219,530 |
| 2021 | $19,187 | $323,780 | $99,830 | $223,950 |
| 2020 | $18,920 | $301,110 | $92,680 | $208,430 |
| 2019 | $18,654 | $301,110 | $92,680 | $208,430 |
| 2018 | $19,678 | $293,640 | $82,380 | $211,260 |
| 2017 | $19,411 | $293,640 | $82,380 | $211,260 |
| 2016 | $20,822 | $299,440 | $72,090 | $227,350 |
| 2015 | $21,948 | $299,440 | $72,090 | $227,350 |
| 2014 | $17,066 | $252,920 | $98,340 | $154,580 |
Source: Public Records
Map
Nearby Homes
- 13527 Royal Glen Dr
- 1359 S Mason Rd
- 1473 Mason Valley Rd
- 1106 Wheaton Hill Ct
- 29a Chapel Hill Estates Dr
- 1536 S Mason Rd
- 1652 Mason Knoll Rd
- 1126 Corrington Ct
- 900 Weidman Rd
- 11 Roclare Ln
- 1004 Weidman Rd
- 11 Summerhill Ln
- 1047 Tidewater Place Ct
- 1515 Topping Rd
- 933 Baintree Ln
- 1369 Thornwick Dr
- 13354 Thornhill Dr
- 939 Wynhaven Ln
- 1136 Weidman Rd
- 1826 S Mason Rd
- 5 Lochinvar Dr
- 1250 S Mason Rd
- 13334 Cross Land Dr
- 13370 Cross Land Dr
- 13348 Cross Land Dr
- 6 Lochinvar Dr
- 1228 S Mason Rd
- 13320 Cross Land Dr
- 13412 Kings Glen Dr
- 4 Lochinvar Dr
- 8 Lochinvar Dr
- 1220 S Mason Rd
- 13343 Cross Land Dr
- 3 Lochinvar Dr
- 13430 Kings Glen Dr
- 13366 Kings Glen Dr
- 1260 Royal Glen Dr
- 13312 Cross Land Dr
- 13325 Cross Land Dr
- 1248 Royal Glen Dr