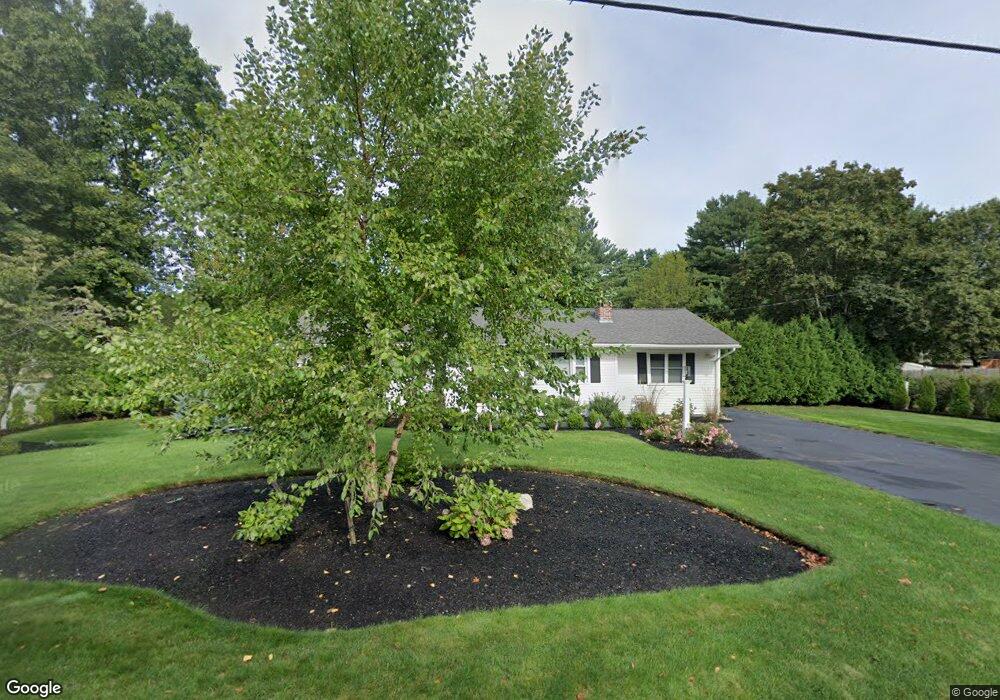
70 Franklin Rd Hanover, MA 02339
Estimated Value: $527,000 - $622,000
3
Beds
2
Baths
1,310
Sq Ft
$437/Sq Ft
Est. Value
About This Home
This home is located at 70 Franklin Rd, Hanover, MA 02339 and is currently estimated at $573,105, approximately $437 per square foot. 70 Franklin Rd is a home located in Plymouth County with nearby schools including Hanover High School and Calvary Chapel Academy.
Ownership History
Date
Name
Owned For
Owner Type
Purchase Details
Closed on
Feb 11, 2009
Sold by
Caruso Gina M
Bought by
Farrell William and Caruso Gina M
Current Estimated Value
Home Financials for this Owner
Home Financials are based on the most recent Mortgage that was taken out on this home.
Original Mortgage
$250,000
Outstanding Balance
$158,695
Interest Rate
5.26%
Mortgage Type
Purchase Money Mortgage
Estimated Equity
$414,410
Purchase Details
Closed on
Mar 29, 2002
Sold by
Corkum Marjorie C and Foca Barbara A
Bought by
Caruso Gina M
Create a Home Valuation Report for This Property
The Home Valuation Report is an in-depth analysis detailing your home's value as well as a comparison with similar homes in the area
Home Values in the Area
Average Home Value in this Area
Purchase History
| Date | Buyer | Sale Price | Title Company |
|---|---|---|---|
| Farrell William | -- | -- | |
| Farrell William | -- | -- | |
| Caruso Gina M | $217,000 | -- | |
| Caruso Gina M | $217,000 | -- |
Source: Public Records
Mortgage History
| Date | Status | Borrower | Loan Amount |
|---|---|---|---|
| Open | Caruso Gina M | $250,000 | |
| Closed | Caruso Gina M | $250,000 | |
| Previous Owner | Caruso Gina M | $50,000 | |
| Previous Owner | Caruso Gina M | $212,600 |
Source: Public Records
Tax History Compared to Growth
Tax History
| Year | Tax Paid | Tax Assessment Tax Assessment Total Assessment is a certain percentage of the fair market value that is determined by local assessors to be the total taxable value of land and additions on the property. | Land | Improvement |
|---|---|---|---|---|
| 2025 | $5,911 | $478,600 | $210,300 | $268,300 |
| 2024 | $6,145 | $478,600 | $210,300 | $268,300 |
| 2023 | $5,642 | $418,200 | $191,300 | $226,900 |
| 2022 | $6,024 | $395,000 | $215,200 | $179,800 |
| 2021 | $4,247 | $359,600 | $184,800 | $174,800 |
| 2020 | $320 | $344,100 | $173,900 | $170,200 |
| 2019 | $4,994 | $304,300 | $152,200 | $152,100 |
| 2018 | $316 | $304,400 | $169,600 | $134,800 |
| 2017 | $4,657 | $281,900 | $158,100 | $123,800 |
| 2016 | $4,753 | $281,900 | $158,100 | $123,800 |
| 2015 | $4,315 | $267,200 | $158,100 | $109,100 |
Source: Public Records
Map
Nearby Homes