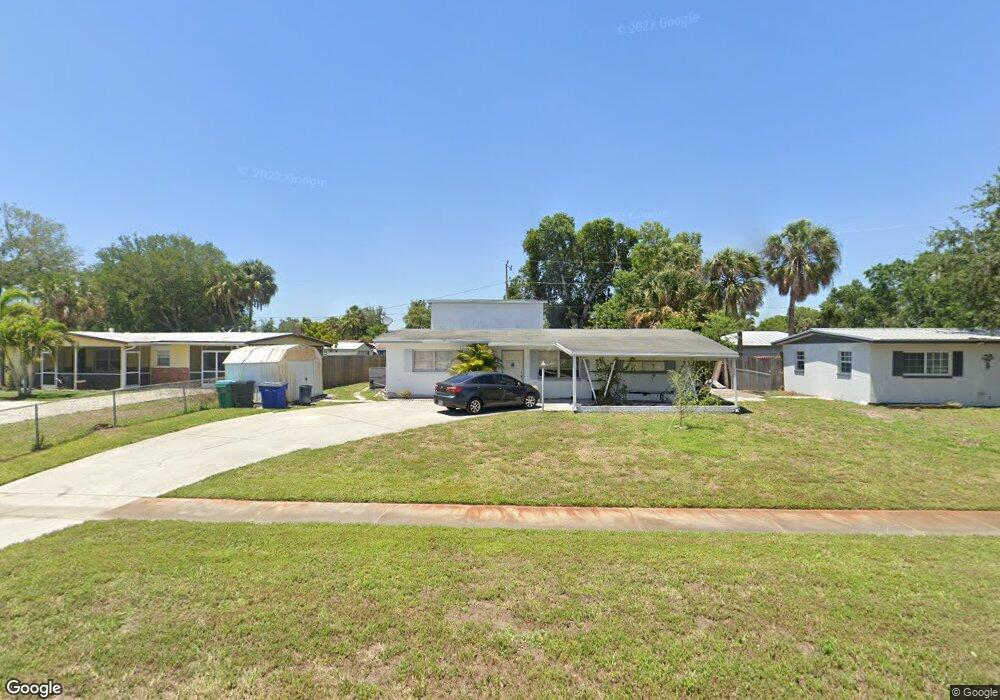
700 Camellia Dr North Fort Myers, FL 33903
Hancock NeighborhoodEstimated Value: $237,000 - $279,492
4
Beds
3
Baths
2,315
Sq Ft
$111/Sq Ft
Est. Value
About This Home
This home is located at 700 Camellia Dr, North Fort Myers, FL 33903 and is currently estimated at $257,623, approximately $111 per square foot. 700 Camellia Dr is a home located in Lee County with nearby schools including Tropic Isles Elementary School, Hancock Creek Elementary School, and Dr. Carrie D. Robinson Littleton Elementary School.
Ownership History
Date
Name
Owned For
Owner Type
Purchase Details
Closed on
Apr 2, 2015
Sold by
Johnson Horace
Bought by
Dooley Donna
Current Estimated Value
Purchase Details
Closed on
Jul 15, 2008
Sold by
Us Bank Na
Bought by
Johnson Horace Robert
Purchase Details
Closed on
Jun 5, 2008
Sold by
Donahue Stephen
Bought by
Us Bank Na and Lehman Sail 2005-10
Purchase Details
Closed on
Sep 26, 2005
Sold by
Kitchens Theresa Marie and Olff Theresa Marie Kithens N
Bought by
Donahue Stephen
Home Financials for this Owner
Home Financials are based on the most recent Mortgage that was taken out on this home.
Original Mortgage
$194,320
Interest Rate
7.65%
Mortgage Type
Balloon
Purchase Details
Closed on
Jul 23, 1998
Sold by
Kitchens William Kyle and Kitchens Theresa Marie
Bought by
Kitchens Theresa Marie
Create a Home Valuation Report for This Property
The Home Valuation Report is an in-depth analysis detailing your home's value as well as a comparison with similar homes in the area
Home Values in the Area
Average Home Value in this Area
Purchase History
| Date | Buyer | Sale Price | Title Company |
|---|---|---|---|
| Dooley Donna | -- | None Available | |
| Johnson Horace Robert | $63,500 | Sunbelt Title Agency | |
| Us Bank Na | -- | None Available | |
| Donahue Stephen | $242,900 | Pinnacle Title Company Inc | |
| Kitchens Theresa Marie | -- | -- |
Source: Public Records
Mortgage History
| Date | Status | Borrower | Loan Amount |
|---|---|---|---|
| Previous Owner | Donahue Stephen | $194,320 |
Source: Public Records
Tax History Compared to Growth
Tax History
| Year | Tax Paid | Tax Assessment Tax Assessment Total Assessment is a certain percentage of the fair market value that is determined by local assessors to be the total taxable value of land and additions on the property. | Land | Improvement |
|---|---|---|---|---|
| 2025 | $1,217 | $102,799 | -- | -- |
| 2024 | $1,169 | $99,902 | -- | -- |
| 2023 | $1,169 | $96,992 | $0 | $0 |
| 2022 | $1,318 | $94,167 | $0 | $0 |
| 2021 | $1,250 | $153,356 | $18,869 | $134,487 |
| 2020 | $1,244 | $90,162 | $0 | $0 |
| 2019 | $980 | $88,135 | $0 | $0 |
| 2018 | $980 | $86,492 | $0 | $0 |
| 2017 | $2,085 | $109,018 | $6,615 | $102,403 |
| 2016 | $1,848 | $98,239 | $11,101 | $87,138 |
| 2015 | $490 | $81,602 | $8,506 | $73,096 |
| 2014 | $469 | $64,304 | $7,604 | $56,700 |
| 2013 | -- | $61,802 | $7,056 | $54,746 |
Source: Public Records
Map
Nearby Homes
- 995 April Ln
- 897 Iris Dr
- 9346 Palm Island Cir
- 13362 Queen Palm Run
- 1221 Barrett Rd Unit 905
- 13358 Queen Palm Run
- 13460 Wild Cotton Ct
- 860 Camellia Dr
- 13421 Wild Cotton Ct
- 679 Canal Dr
- 9439 Palm Island Cir
- 1195 Green Ave
- 13317 Queen Palm Run
- 847 Hydrangea Dr
- 1242 Forsyth Dr
- 992 Tropical Palm Ave
- 4930 Orange Grove Blvd
- 938 Tropical Palm Ave
- 13110 Silver Thorn Loop
- 12901 Seaside Key Ct