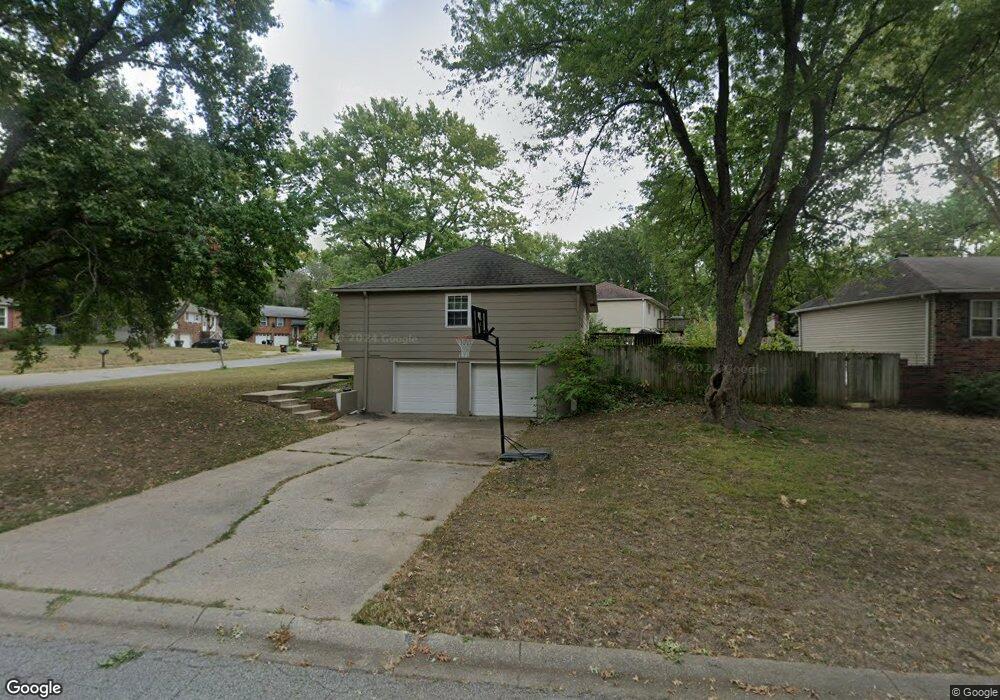
700 NW Oxford Dr Blue Springs, MO 64015
Estimated Value: $236,000 - $255,000
3
Beds
2
Baths
1,120
Sq Ft
$220/Sq Ft
Est. Value
About This Home
This home is located at 700 NW Oxford Dr, Blue Springs, MO 64015 and is currently estimated at $245,910, approximately $219 per square foot. 700 NW Oxford Dr is a home located in Jackson County with nearby schools including James Lewis Elementary School, Brittany Hill Middle School, and Blue Springs High School.
Ownership History
Date
Name
Owned For
Owner Type
Purchase Details
Closed on
Feb 15, 2012
Sold by
Roi Realty Inc
Bought by
Benchmark Properties Viii Llc
Current Estimated Value
Purchase Details
Closed on
Dec 19, 2011
Sold by
Shenkel Michael D and Shenkel Tamara L
Bought by
Roi Realty Inc
Purchase Details
Closed on
Jul 31, 2006
Sold by
Shenkel Michael D and Shenkel Tamara L
Bought by
Shenkel Michael D and Shenkel Tamara L
Home Financials for this Owner
Home Financials are based on the most recent Mortgage that was taken out on this home.
Original Mortgage
$109,000
Interest Rate
8.39%
Mortgage Type
Stand Alone Refi Refinance Of Original Loan
Purchase Details
Closed on
May 24, 2002
Sold by
Long Daniel S
Bought by
Long Tamara L
Home Financials for this Owner
Home Financials are based on the most recent Mortgage that was taken out on this home.
Original Mortgage
$92,128
Interest Rate
6.92%
Mortgage Type
Purchase Money Mortgage
Create a Home Valuation Report for This Property
The Home Valuation Report is an in-depth analysis detailing your home's value as well as a comparison with similar homes in the area
Home Values in the Area
Average Home Value in this Area
Purchase History
| Date | Buyer | Sale Price | Title Company |
|---|---|---|---|
| Benchmark Properties Viii Llc | -- | None Available | |
| Roi Realty Inc | $46,801 | None Available | |
| Shenkel Michael D | -- | Ctic | |
| Long Tamara L | -- | -- |
Source: Public Records
Mortgage History
| Date | Status | Borrower | Loan Amount |
|---|---|---|---|
| Previous Owner | Shenkel Michael D | $109,000 | |
| Previous Owner | Long Tamara L | $92,128 |
Source: Public Records
Tax History Compared to Growth
Tax History
| Year | Tax Paid | Tax Assessment Tax Assessment Total Assessment is a certain percentage of the fair market value that is determined by local assessors to be the total taxable value of land and additions on the property. | Land | Improvement |
|---|---|---|---|---|
| 2025 | $3,054 | $31,159 | $6,240 | $24,919 |
| 2024 | $2,996 | $37,436 | $5,159 | $32,277 |
| 2023 | $2,996 | $37,436 | $4,860 | $32,576 |
| 2022 | $2,133 | $23,560 | $5,311 | $18,249 |
| 2021 | $2,131 | $23,560 | $5,311 | $18,249 |
| 2020 | $1,906 | $21,434 | $5,311 | $16,123 |
| 2019 | $1,843 | $21,434 | $5,311 | $16,123 |
| 2018 | $892,312 | $18,395 | $2,762 | $15,633 |
| 2017 | $1,447 | $18,395 | $2,762 | $15,633 |
| 2016 | $1,447 | $16,245 | $2,299 | $13,946 |
| 2014 | $1,251 | $14,003 | $3,114 | $10,889 |
Source: Public Records
Map
Nearby Homes
- 2916 NW Chelsea Place
- 1029 NW Berkshire Dr
- 516 NW Mill Ct
- 913 NW Camelot Ct
- 2804 NW Kingsridge Dr
- 2508 NW Castle Dr
- 3213 NW Canterbury Place
- 3212 NW Canterbury Rd
- 2317 NW Kensington Ct
- 124 SW 27th St
- 3605 NW Dogwood Dr
- 704 NW 39th St
- 3616 NW Dogwood Dr
- 216 SW 26th St
- 41 Clipper Dr
- 308 SW Woods Chapel Rd
- 3012 SW Moore St
- 1618 NW Samantha Ct
- 4012 NW Delwood Ct
- 1389 NW Jefferson Ct
- 620 NW Oxford Dr
- 2812 NW Hartford Ct
- 2901 NW Chelsea Place
- 708 NW Oxford Dr
- 2900 NW Chelsea Place
- 2905 NW Chelsea Place
- 2900 NW Bristol Ct
- 612 NW Oxford Dr
- 2808 NW Hartford Ct
- 712 NW Oxford Dr
- 2811 NW Hartford Ct
- 2904 NW Bristol Ct
- 2904 NW Chelsea Place
- 800 NW Oxford Dr
- 2909 NW Chelsea Place
- 2800 NW Hartford Ct
- 2807 NW Hartford Ct
- 2801 NW Castle Dr
- 2901 NW Bristol Ct
- 2717 NW Castle Dr