Estimated Value: $202,000 - $298,000
2
Beds
1
Bath
848
Sq Ft
$287/Sq Ft
Est. Value
About This Home
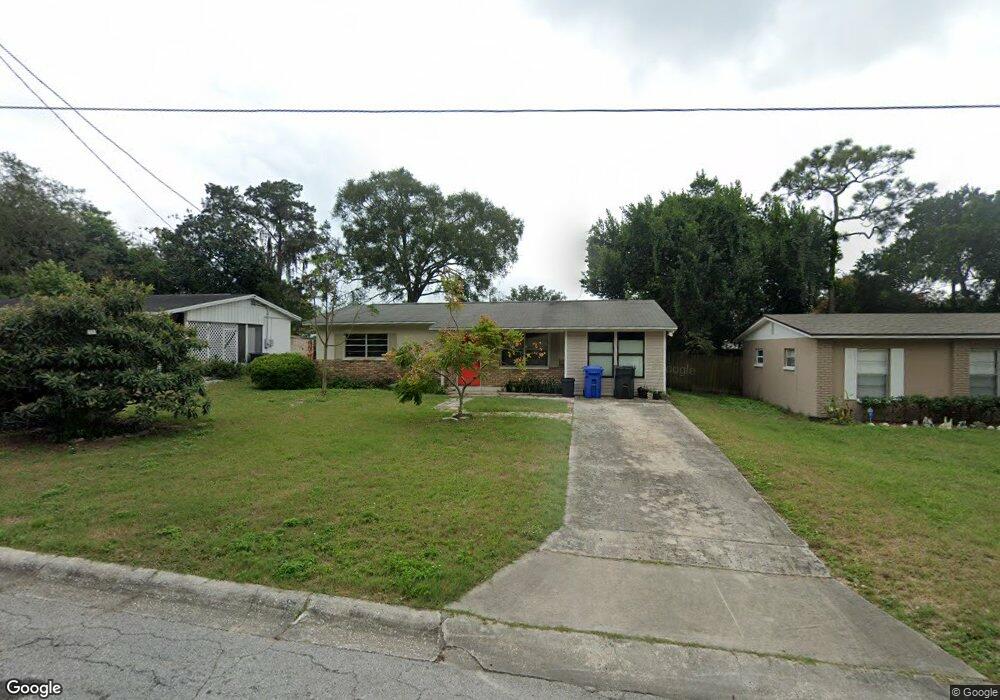
This home is located at 7005 Baywood Dr, Tampa, FL 33637 and is currently estimated at $243,428, approximately $287 per square foot. 7005 Baywood Dr is a home located in Hillsborough County with nearby schools including Folsom Elementary School, Greco Middle School, and King High School.
Ownership History
Date
Name
Owned For
Owner Type
Purchase Details
Closed on
Mar 24, 2006
Sold by
Bailey Anne M and Myers Kristen M
Bought by
Thorpe David W
Current Estimated Value
Home Financials for this Owner
Home Financials are based on the most recent Mortgage that was taken out on this home.
Original Mortgage
$104,500
Outstanding Balance
$59,129
Interest Rate
6.19%
Mortgage Type
Fannie Mae Freddie Mac
Estimated Equity
$184,299
Purchase Details
Closed on
Oct 9, 2003
Sold by
Emke Gregory
Bought by
Bailey Anne M and Myers Kristin M
Purchase Details
Closed on
Sep 11, 2001
Sold by
Bailey Anne M
Bought by
Emke Gregory
Home Financials for this Owner
Home Financials are based on the most recent Mortgage that was taken out on this home.
Original Mortgage
$68,918
Interest Rate
7.02%
Mortgage Type
FHA
Purchase Details
Closed on
Dec 16, 1996
Sold by
Cunningham Gene E
Bought by
Bailey Anne M
Create a Home Valuation Report for This Property
The Home Valuation Report is an in-depth analysis detailing your home's value as well as a comparison with similar homes in the area
Home Values in the Area
Average Home Value in this Area
Purchase History
| Date | Buyer | Sale Price | Title Company |
|---|---|---|---|
| Thorpe David W | $132,500 | Brokers Title Of Tampa Iii | |
| Bailey Anne M | $69,000 | Anchor Title & Associates In | |
| Emke Gregory | $70,000 | -- | |
| Bailey Anne M | $20,000 | -- |
Source: Public Records
Mortgage History
| Date | Status | Borrower | Loan Amount |
|---|---|---|---|
| Open | Thorpe David W | $104,500 | |
| Previous Owner | Bailey Anne M | $68,918 |
Source: Public Records
Tax History Compared to Growth
Tax History
| Year | Tax Paid | Tax Assessment Tax Assessment Total Assessment is a certain percentage of the fair market value that is determined by local assessors to be the total taxable value of land and additions on the property. | Land | Improvement |
|---|---|---|---|---|
| 2024 | $1,005 | $47,905 | -- | -- |
| 2023 | $942 | $46,510 | $0 | $0 |
| 2022 | $820 | $45,155 | $0 | $0 |
| 2021 | $790 | $43,840 | $0 | $0 |
| 2020 | $718 | $43,235 | $0 | $0 |
| 2019 | $649 | $42,263 | $0 | $0 |
| 2018 | $598 | $39,536 | $0 | $0 |
| 2017 | $580 | $63,063 | $0 | $0 |
| 2016 | $549 | $37,927 | $0 | $0 |
| 2015 | $549 | $37,663 | $0 | $0 |
| 2014 | $527 | $37,364 | $0 | $0 |
| 2013 | -- | $36,812 | $0 | $0 |
Source: Public Records
Map
Nearby Homes
- 8508 Tupelo Dr
- 8904 Tupelo Dr
- 8801 Chinaberry Dr
- 7316 Willow Park Dr
- 7106 Lynwood Dr
- 8407 Caladesi Island Dr
- 8309 Tupelo Dr
- 8406 Renald Blvd
- 7025 Allview Dr
- 7613 S Sanibel Cir
- 8211 Broward Place
- 7705 Willow Park Dr Unit IIB
- 7712 Willow Park Dr
- 7715 Gulf Ct
- 7515 Wakulla Dr
- 7502 Gadsden Dr
- 8419 Laurelon Place
- 8632 Cattail Dr
- 8626 Cattail Dr
- 8601 Cattail Dr Unit 133
- 7007 Baywood Dr
- 7003 Baywood Dr
- 7006 Conifer Dr
- 7008 Conifer Dr
- 7004 Conifer Dr
- 7009 Baywood Dr
- 7001 Baywood Dr
- 7006 Baywood Dr
- 7010 Conifer Dr
- 8515 Tupelo Dr
- 7008 Baywood Dr
- 7004 Baywood Dr
- 7011 Baywood Dr
- 7010 Baywood Dr
- 8603 Tupelo Dr
- 7012 Conifer Dr
- 7012 Baywood Dr
- 7013 Baywood Dr
- 7005 Conifer Dr
- 7005 Tamarack Dr