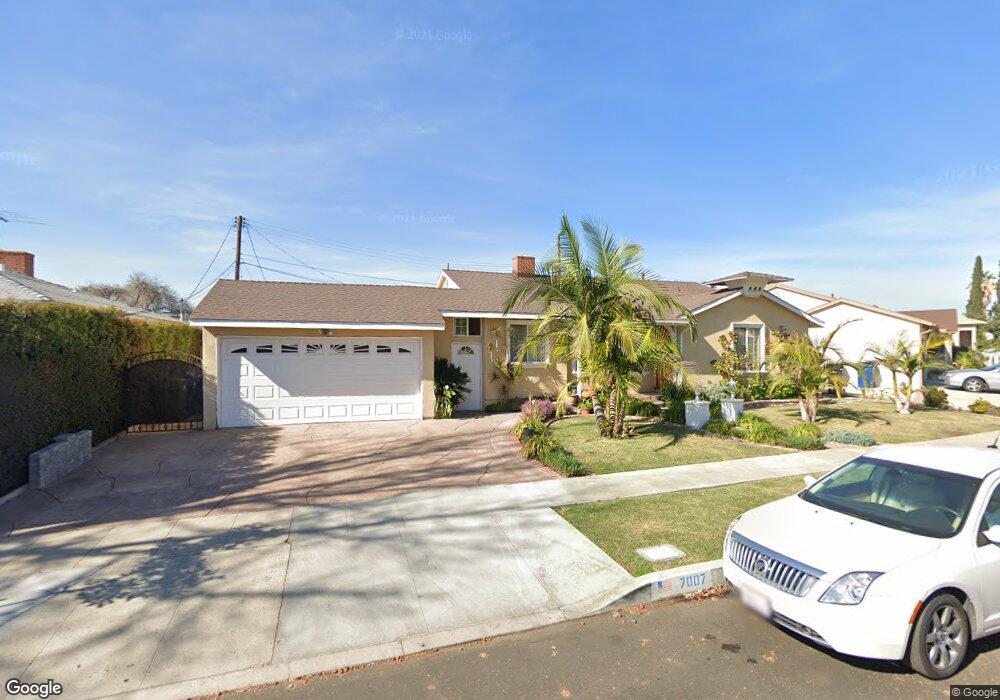
7007 Nagle Ave North Hollywood, CA 91605
North Hollywood NeighborhoodEstimated Value: $767,000 - $878,000
3
Beds
2
Baths
1,364
Sq Ft
$608/Sq Ft
Est. Value
About This Home
This home is located at 7007 Nagle Ave, North Hollywood, CA 91605 and is currently estimated at $829,362, approximately $608 per square foot. 7007 Nagle Ave is a home located in Los Angeles County with nearby schools including Kittridge Street Elementary, James Madison Middle, and Ulysses S. Grant Senior High School.
Ownership History
Date
Name
Owned For
Owner Type
Purchase Details
Closed on
Jun 5, 2025
Sold by
Rodriguez Teresa
Bought by
Tr Family Trust and Rodriguez
Current Estimated Value
Purchase Details
Closed on
Nov 14, 2011
Sold by
Rodriguez Teresa and Cornejo Miguel
Bought by
Rodriguez Teresa
Home Financials for this Owner
Home Financials are based on the most recent Mortgage that was taken out on this home.
Original Mortgage
$129,150
Interest Rate
4.09%
Mortgage Type
New Conventional
Purchase Details
Closed on
Mar 29, 2000
Sold by
Bidamar Corp
Bought by
Rodriguez Teresa and Cornejo Miguel
Home Financials for this Owner
Home Financials are based on the most recent Mortgage that was taken out on this home.
Original Mortgage
$173,787
Interest Rate
8.25%
Mortgage Type
FHA
Purchase Details
Closed on
Nov 16, 1995
Sold by
Citibank Fsb
Bought by
Bidamar Corp
Purchase Details
Closed on
Jan 25, 1995
Sold by
Dominique Gerard Luc and Dominique Marie Therese
Bought by
Citibank Fsb
Create a Home Valuation Report for This Property
The Home Valuation Report is an in-depth analysis detailing your home's value as well as a comparison with similar homes in the area
Home Values in the Area
Average Home Value in this Area
Purchase History
| Date | Buyer | Sale Price | Title Company |
|---|---|---|---|
| Tr Family Trust | -- | None Listed On Document | |
| Rodriguez Teresa | -- | Lsi | |
| Rodriguez Teresa | $175,000 | Chicago Title | |
| Bidamar Corp | $124,000 | Stewart Title | |
| Citibank Fsb | -- | North American Title Company |
Source: Public Records
Mortgage History
| Date | Status | Borrower | Loan Amount |
|---|---|---|---|
| Previous Owner | Rodriguez Teresa | $129,150 | |
| Previous Owner | Rodriguez Teresa | $173,787 |
Source: Public Records
Tax History Compared to Growth
Tax History
| Year | Tax Paid | Tax Assessment Tax Assessment Total Assessment is a certain percentage of the fair market value that is determined by local assessors to be the total taxable value of land and additions on the property. | Land | Improvement |
|---|---|---|---|---|
| 2025 | $3,762 | $297,669 | $196,347 | $101,322 |
| 2024 | $3,762 | $291,834 | $192,498 | $99,336 |
| 2023 | $3,693 | $286,113 | $188,724 | $97,389 |
| 2022 | $3,525 | $280,504 | $185,024 | $95,480 |
| 2021 | $3,477 | $275,005 | $181,397 | $93,608 |
| 2019 | $3,376 | $266,850 | $176,017 | $90,833 |
| 2018 | $3,293 | $261,618 | $172,566 | $89,052 |
| 2016 | $3,136 | $251,461 | $165,866 | $85,595 |
| 2015 | $3,092 | $247,685 | $163,375 | $84,310 |
| 2014 | $3,110 | $242,834 | $160,175 | $82,659 |
Source: Public Records
Map
Nearby Homes
- 7045 Varna Ave
- 7021 Fulton Ave
- 7115 Park Manor Ave
- 13455 Bassett St
- 6850 Longridge Ave
- 6818 Varna Ave
- 6828 Fulton Ave
- 13400 Hartland St
- 7020 Mary Ellen Ave
- 13211 Vanowen St Unit 9
- 13127 Hartland St
- 13226 Vanowen St
- 7100 Woodman Ave
- 6924 Woodman Ave
- 13061 Vanowen St
- 7060 Morse Ave
- 6851 Woodman Ave
- 7128 Mammoth Ave
- 13015 Vanowen St
- 7342 Ventura Canyon Ave
- 7019 Nagle Ave
- 7001 Nagle Ave
- 7016 Park Manor Ave
- 7028 Park Manor Ave
- 7027 Nagle Ave
- 7006 Nagle Ave
- 7012 Nagle Ave
- 7034 Park Manor Ave
- 7000 Nagle Ave
- 7018 Nagle Ave
- 7035 Nagle Ave
- 7040 Park Manor Ave
- 7022 Nagle Ave
- 7001 Park Manor Ave
- 7007 Park Manor Ave
- 7027 Park Manor Ave
- 7021 Park Manor Ave
- 7028 Nagle Ave Unit 1
- 7028 Nagle Ave
- 7017 Park Manor Ave