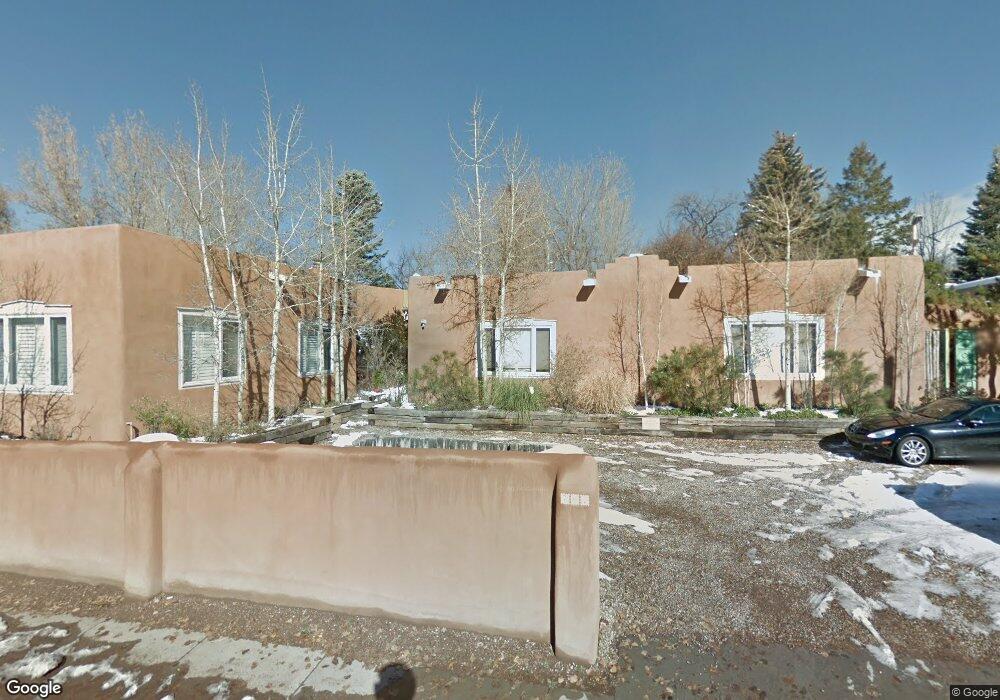
701 E Alameda St Unit 4 Santa Fe, NM 87501
North Hills NeighborhoodEstimated Value: $861,343 - $944,000
2
Beds
2
Baths
1,343
Sq Ft
$672/Sq Ft
Est. Value
About This Home
This home is located at 701 E Alameda St Unit 4, Santa Fe, NM 87501 and is currently estimated at $903,086, approximately $672 per square foot. 701 E Alameda St Unit 4 is a home located in Santa Fe County with nearby schools including Acequia Madre Elementary School, Santa Fe High School, and New Mexico School for the Arts.
Ownership History
Date
Name
Owned For
Owner Type
Purchase Details
Closed on
Jul 29, 2019
Sold by
Sullivan Robert J and Sullivan Gemma S
Bought by
Hays C Lansing and Hays Monica
Current Estimated Value
Purchase Details
Closed on
Aug 8, 2017
Sold by
Sullivan Robert J and Sullivan Germma S
Bought by
Sullivan Robert J and Sullivan Gemma S
Purchase Details
Closed on
Aug 4, 2017
Sold by
Kimball Rentals Llc
Bought by
Sullivan Robert J and Sullivan Gemma S
Purchase Details
Closed on
Jul 31, 2017
Sold by
Kimball Jennifer Lea and Kimball Robert
Bought by
Kimball Rentals Llc
Purchase Details
Closed on
Mar 15, 2001
Sold by
Unger James L and Unger Solveiga L
Bought by
Wise Jennifer Lea
Home Financials for this Owner
Home Financials are based on the most recent Mortgage that was taken out on this home.
Original Mortgage
$209,120
Interest Rate
6.95%
Create a Home Valuation Report for This Property
The Home Valuation Report is an in-depth analysis detailing your home's value as well as a comparison with similar homes in the area
Home Values in the Area
Average Home Value in this Area
Purchase History
| Date | Buyer | Sale Price | Title Company |
|---|---|---|---|
| Hays C Lansing | -- | Prima Title Llc | |
| Sullivan Robert J | -- | Prima Title Llc | |
| Sullivan Robert J | -- | Prima Title Llc | |
| Kimball Rentals Llc | -- | None Available | |
| Wise Jennifer Lea | -- | Territorial Abstract & Title |
Source: Public Records
Mortgage History
| Date | Status | Borrower | Loan Amount |
|---|---|---|---|
| Previous Owner | Wise Jennifer Lea | $209,120 |
Source: Public Records
Tax History Compared to Growth
Tax History
| Year | Tax Paid | Tax Assessment Tax Assessment Total Assessment is a certain percentage of the fair market value that is determined by local assessors to be the total taxable value of land and additions on the property. | Land | Improvement |
|---|---|---|---|---|
| 2024 | $3,909 | $512,963 | -- | $512,963 |
| 2023 | $3,909 | $498,023 | $0 | $498,023 |
| 2022 | $3,823 | $483,518 | $0 | $483,518 |
| 2021 | $3,763 | $156,478 | $0 | $156,478 |
| 2020 | $3,787 | $157,591 | $0 | $157,591 |
| 2019 | $3,515 | $144,029 | $0 | $144,029 |
| 2018 | $3,541 | $144,029 | $0 | $144,029 |
| 2017 | $2,725 | $110,378 | $0 | $110,378 |
| 2016 | $2,569 | $107,164 | $0 | $107,164 |
| 2015 | $2,509 | $104,043 | $0 | $104,043 |
| 2014 | $2,360 | $100,911 | $0 | $100,911 |
Source: Public Records
Map
Nearby Homes
- 637 E Alameda St
- 629 E Palace Ave Unit 1
- 1713-C W Alameda St Unit C
- 606 E Palace Ave
- 541 E Alameda St Unit B
- 614 E Alameda St
- 707 E Palace Ave Unit 8
- 707 E Palace Ave Unit 11
- 220 Rodriguez St
- 630 E Alameda St Unit A, B, C, E, F, G & I
- 653 Canyon Rd Unit 11
- 634 Canyon Rd
- 800 La Vereda Este
- 868 E Alameda St
- 808 La Vereda Este
- 1 Cerro Gordo Rd Unit B
- 812 La Vereda Este
- 5 Cerro Gordo Rd Unit 1
- 259 Montoya Cir Unit 2
- 404 San Antonio St
- 701 E Alameda St
- 701 E Alameda St Unit 1
- 701 E Alameda St
- 701 E Alameda St Unit 4
- 701 E Alameda #3
- 701 E Alameda #4
- 651 E Alameda St
- 700 E Palace Ave
- 702 E Palace Ave
- 636 E Palace Ave
- 704 E Palace Ave
- 635 E Alameda St
- 635 1/2 E Alameda St
- 632 E Palace Ave
- 632 E Palace Ave Unit 1
- 705 E Alameda St
- 628 E Palace Ave
- 633 E Alameda St
- 705 E Palace Ave
- 651 E Palace Ave