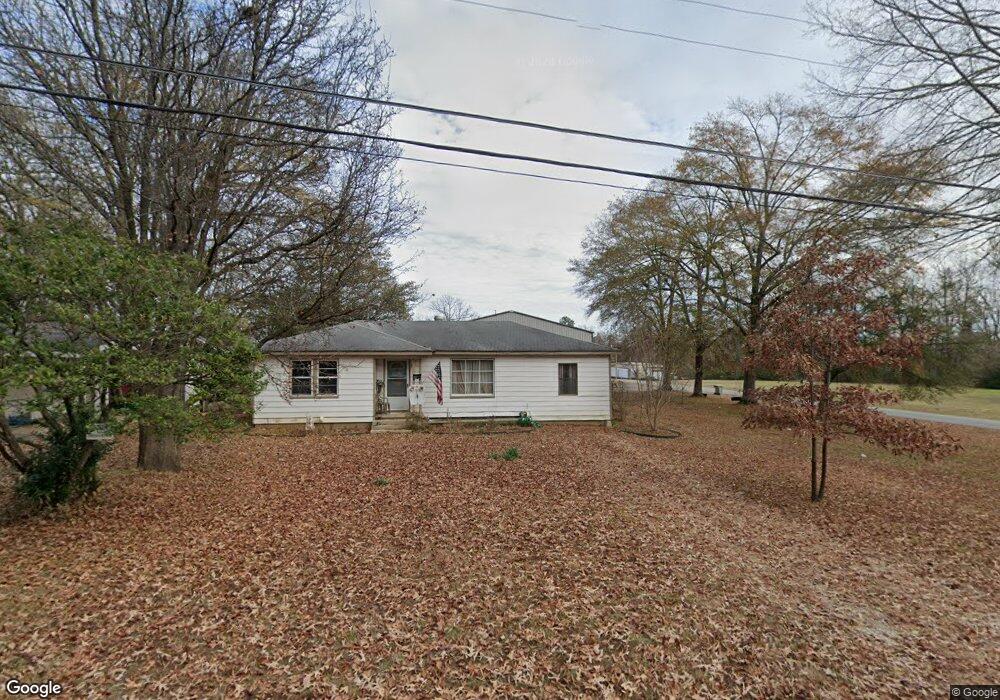
702 N Oak St Sheridan, AR 72150
Estimated Value: $132,000 - $189,000
--
Bed
1
Bath
1,191
Sq Ft
$135/Sq Ft
Est. Value
About This Home
This home is located at 702 N Oak St, Sheridan, AR 72150 and is currently estimated at $160,333, approximately $134 per square foot. 702 N Oak St is a home located in Grant County with nearby schools including Sheridan High School.
Ownership History
Date
Name
Owned For
Owner Type
Purchase Details
Closed on
Nov 20, 2019
Sold by
Holmes and Keisler Daniel
Bought by
Majestic Concepts Inc
Current Estimated Value
Home Financials for this Owner
Home Financials are based on the most recent Mortgage that was taken out on this home.
Original Mortgage
$46,350
Outstanding Balance
$40,897
Interest Rate
3.75%
Mortgage Type
Commercial
Estimated Equity
$119,436
Purchase Details
Closed on
Feb 17, 2010
Sold by
Sample Larry G
Bought by
Burrow Lonnie E
Purchase Details
Closed on
Jul 23, 1996
Bought by
Sample
Purchase Details
Closed on
Jul 13, 1992
Bought by
Sample
Create a Home Valuation Report for This Property
The Home Valuation Report is an in-depth analysis detailing your home's value as well as a comparison with similar homes in the area
Home Values in the Area
Average Home Value in this Area
Purchase History
| Date | Buyer | Sale Price | Title Company |
|---|---|---|---|
| Majestic Concepts Inc | -- | -- | |
| Burrow Lonnie E | $1,000 | None Available | |
| Sample | -- | -- | |
| Sample | $30,000 | -- |
Source: Public Records
Mortgage History
| Date | Status | Borrower | Loan Amount |
|---|---|---|---|
| Open | Majestic Concepts Inc | $46,350 |
Source: Public Records
Tax History Compared to Growth
Tax History
| Year | Tax Paid | Tax Assessment Tax Assessment Total Assessment is a certain percentage of the fair market value that is determined by local assessors to be the total taxable value of land and additions on the property. | Land | Improvement |
|---|---|---|---|---|
| 2025 | $851 | $25,620 | $10,000 | $15,620 |
| 2024 | $709 | $15,750 | $5,500 | $10,250 |
| 2023 | $709 | $15,750 | $5,500 | $10,250 |
| 2022 | $680 | $15,750 | $5,500 | $10,250 |
| 2021 | $623 | $15,750 | $5,500 | $10,250 |
| 2020 | $566 | $12,580 | $3,160 | $9,420 |
| 2019 | $566 | $12,580 | $3,160 | $9,420 |
| 2018 | $566 | $12,580 | $3,160 | $9,420 |
| 2017 | $566 | $12,580 | $3,160 | $9,420 |
| 2015 | -- | $11,290 | $2,710 | $8,580 |
| 2014 | -- | $11,290 | $2,710 | $8,580 |
| 2012 | -- | $11,290 | $2,710 | $8,580 |
Source: Public Records
Map
Nearby Homes