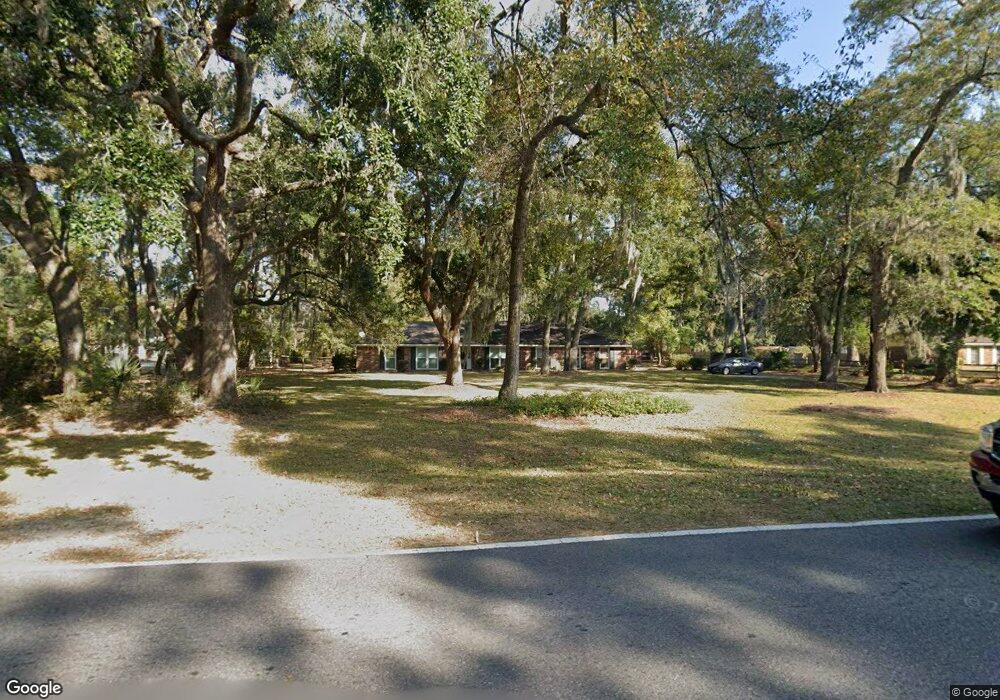
702 Penn Waller Rd Savannah, GA 31410
Estimated Value: $428,000 - $475,000
3
Beds
3
Baths
1,826
Sq Ft
$247/Sq Ft
Est. Value
About This Home
This home is located at 702 Penn Waller Rd, Savannah, GA 31410 and is currently estimated at $451,539, approximately $247 per square foot. 702 Penn Waller Rd is a home located in Chatham County with nearby schools including Howard Elementary School, Coastal Middle School, and Islands High School.
Ownership History
Date
Name
Owned For
Owner Type
Purchase Details
Closed on
Oct 2, 2020
Sold by
Rosenfeld Estelle Z
Bought by
Veiock Harry Glenn
Current Estimated Value
Home Financials for this Owner
Home Financials are based on the most recent Mortgage that was taken out on this home.
Original Mortgage
$152,000
Outstanding Balance
$134,402
Interest Rate
2.9%
Mortgage Type
New Conventional
Estimated Equity
$317,137
Purchase Details
Closed on
Oct 1, 2016
Sold by
Estelle
Bought by
Veiock Barbara J and Veiock Harry Glenn
Purchase Details
Closed on
May 15, 2009
Sold by
Wilson Barbara J
Bought by
Wilson Barbara J and Rosenfeld Estelle
Home Financials for this Owner
Home Financials are based on the most recent Mortgage that was taken out on this home.
Original Mortgage
$181,500
Interest Rate
4.81%
Mortgage Type
New Conventional
Create a Home Valuation Report for This Property
The Home Valuation Report is an in-depth analysis detailing your home's value as well as a comparison with similar homes in the area
Home Values in the Area
Average Home Value in this Area
Purchase History
| Date | Buyer | Sale Price | Title Company |
|---|---|---|---|
| Veiock Harry Glenn | -- | -- | |
| Rosenfeld Estelle Z | -- | -- | |
| Veiock Barbara J | -- | -- | |
| Wilson Barbara J | -- | -- |
Source: Public Records
Mortgage History
| Date | Status | Borrower | Loan Amount |
|---|---|---|---|
| Open | Rosenfeld Estelle Z | $152,000 | |
| Closed | Veiock Harry Glenn | $152,000 | |
| Previous Owner | Wilson Barbara J | $181,500 |
Source: Public Records
Tax History Compared to Growth
Tax History
| Year | Tax Paid | Tax Assessment Tax Assessment Total Assessment is a certain percentage of the fair market value that is determined by local assessors to be the total taxable value of land and additions on the property. | Land | Improvement |
|---|---|---|---|---|
| 2025 | $2,606 | $106,640 | $40,760 | $65,880 |
| 2024 | $2,606 | $83,360 | $40,760 | $42,600 |
| 2023 | $2,105 | $88,080 | $40,760 | $47,320 |
| 2022 | $3,009 | $104,400 | $40,760 | $63,640 |
| 2021 | $3,056 | $101,360 | $40,760 | $60,600 |
| 2020 | $3,091 | $101,360 | $40,760 | $60,600 |
| 2019 | $3,176 | $101,360 | $40,760 | $60,600 |
| 2018 | $2,697 | $100,280 | $40,760 | $59,520 |
| 2017 | $2,660 | $93,000 | $40,760 | $52,240 |
| 2016 | $2,703 | $92,760 | $40,760 | $52,000 |
| 2015 | $2,914 | $105,400 | $41,160 | $64,240 |
| 2014 | $4,226 | $107,160 | $0 | $0 |
Source: Public Records
Map
Nearby Homes
- 127 Penn Station
- 710 Leaning Oaks Dr
- 104 Saint Andrews Way
- 7 Cedar Cove
- 116 Kaitlyn Cove
- 2 Brittlewood Ct
- 908 Betz Creek Rd
- 103 Wassaw Rd
- 1106 Oakleaf Dr
- 113 Wassaw Rd
- 123 Wassaw Rd
- 903 Moss Dr
- 118 Wassaw Rd
- 128 Wassaw Rd
- 1022 Walthour Rd
- 1024 Walthour Rd
- 302 Larbre Rd
- 11 Ossabaw Rd
- 6 Sapelo Rd
- 22 Dockside Dr
- 1110 Cobb Rd
- 704 Penn Waller Rd
- 624 Penn Waller Rd
- 625 Leaning Oaks Dr
- 0 Leaning Oaks Dr Unit 7576604
- 1103 Cobb Rd
- 0 Penn Waller Rd Unit 8129359
- 1105 Cobb Rd
- 627 Leaning Oaks Dr
- 1112 Cobb Rd
- 623 Leaning Oaks Dr
- 1107 Cobb Rd
- 622 Penn Waller Rd
- 629 Leaning Oaks Dr
- 1114 Cobb Rd
- 103 S Sheftall Cir
- 105 S Sheftall Cir
- 706 Penn Waller Rd
- 621 Leaning Oaks Dr
- 631 Leaning Oaks Dr