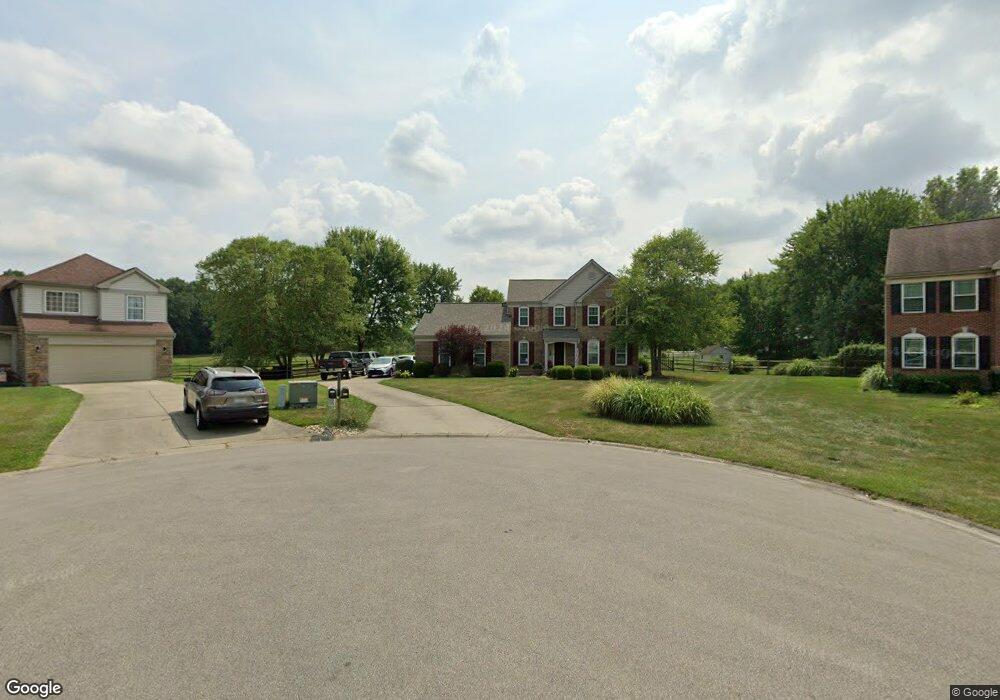
7023 Greenstone Trace Loveland, OH 45140
Estimated Value: $426,655 - $501,000
4
Beds
3
Baths
2,064
Sq Ft
$224/Sq Ft
Est. Value
About This Home
This home is located at 7023 Greenstone Trace, Loveland, OH 45140 and is currently estimated at $462,664, approximately $224 per square foot. 7023 Greenstone Trace is a home located in Clermont County with nearby schools including Marr/Cook Elementary School, Spaulding Elementary School, and Goshen Middle School.
Ownership History
Date
Name
Owned For
Owner Type
Purchase Details
Closed on
Jan 19, 2000
Sold by
Mckenna Brent D
Bought by
Hall Michael J and Hall Angela M
Current Estimated Value
Home Financials for this Owner
Home Financials are based on the most recent Mortgage that was taken out on this home.
Original Mortgage
$133,700
Outstanding Balance
$42,384
Interest Rate
7.81%
Mortgage Type
New Conventional
Estimated Equity
$420,280
Purchase Details
Closed on
Oct 8, 1997
Sold by
Drees Co
Bought by
Mckenna Brent D and Mckenna Tara A
Home Financials for this Owner
Home Financials are based on the most recent Mortgage that was taken out on this home.
Original Mortgage
$166,500
Interest Rate
6.38%
Mortgage Type
New Conventional
Purchase Details
Closed on
May 28, 1997
Sold by
Joint Cobblestone Lucke
Bought by
Drees Co
Create a Home Valuation Report for This Property
The Home Valuation Report is an in-depth analysis detailing your home's value as well as a comparison with similar homes in the area
Home Values in the Area
Average Home Value in this Area
Purchase History
| Date | Buyer | Sale Price | Title Company |
|---|---|---|---|
| Hall Michael J | $183,750 | -- | |
| Mckenna Brent D | $175,280 | -- | |
| Drees Co | $116,000 | -- |
Source: Public Records
Mortgage History
| Date | Status | Borrower | Loan Amount |
|---|---|---|---|
| Open | Hall Michael J | $133,700 | |
| Previous Owner | Mckenna Brent D | $166,500 |
Source: Public Records
Tax History Compared to Growth
Tax History
| Year | Tax Paid | Tax Assessment Tax Assessment Total Assessment is a certain percentage of the fair market value that is determined by local assessors to be the total taxable value of land and additions on the property. | Land | Improvement |
|---|---|---|---|---|
| 2024 | $5,211 | $116,840 | $19,290 | $97,550 |
| 2023 | $5,050 | $116,840 | $19,290 | $97,550 |
| 2022 | $3,955 | $80,540 | $13,300 | $67,240 |
| 2021 | $3,979 | $80,540 | $13,300 | $67,240 |
| 2020 | $3,717 | $80,540 | $13,300 | $67,240 |
| 2019 | $3,331 | $69,270 | $13,230 | $56,040 |
| 2018 | $3,346 | $69,270 | $13,230 | $56,040 |
| 2017 | $3,349 | $69,270 | $13,230 | $56,040 |
| 2016 | $3,026 | $58,700 | $11,200 | $47,500 |
| 2015 | $2,730 | $58,700 | $11,200 | $47,500 |
| 2014 | $2,730 | $58,700 | $11,200 | $47,500 |
| 2013 | $2,392 | $53,660 | $12,250 | $41,410 |
Source: Public Records
Map
Nearby Homes
- 6853 Obannon Bluff
- 6822 Bunkerwood Dr
- 1487 Sawgrass Ridge Dr
- 6874 Clubside Dr
- 6875 Stonehedge Cir
- 6805 N Clarawill Dr
- Vaquero Plan at Stone Pillars
- Lexington Plan at Stone Pillars
- 1383 Stone Pillars Ct Unit Lot10
- 6769 Park Cir
- 4039 Oakland Hills Dr
- 6647 Saddleback Way
- 6650 Saddleback Way
- 6651 Saddleback Way
- 6651 Saddleback Way Unit Lot13
- 1333 Cross Creek Dr
- 6646 Gentlewind Ct
- 6661 Gentlewind Ct
- 6725 Oakland Rd
- Brookside Plan at Oakridge Estates - Signature Series
- 7021 Greenstone Trace
- 7026 Greenstone Trace
- 7024 Greenstone Trace
- 1308 Sandwood Dr
- 7019 Greenstone Trace
- 1306 Sandwood Dr
- 7022 Greenstone Trace
- 1310 Sandwood Dr
- 7017 Greenstone Trace
- 1304 Sandwood Dr
- 7020 Greenstone Trace
- 7018 Greenstone Trace
- 7015 Greenstone Trace
- 1302 Sandwood Dr
- 1307 Sandwood Dr
- 1305 Sandwood Dr
- 6846 Clubside Dr
- 1303 Sandwood Dr
- 7016 Greenstone Trace
- 6848 Clubside Dr