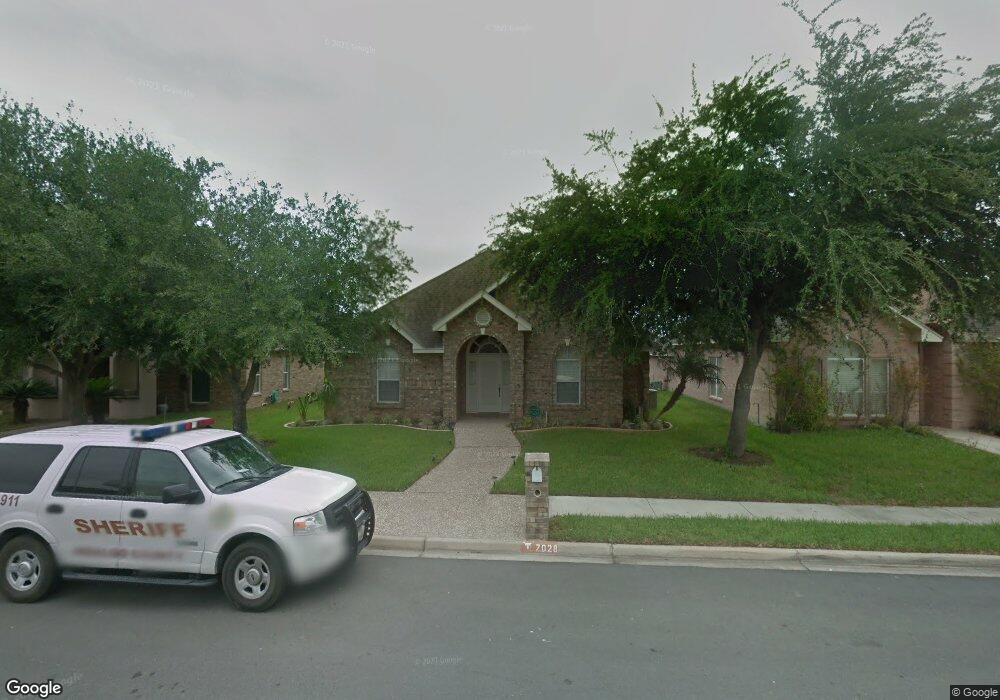
7028 N 5th St McAllen, TX 78504
Estimated Value: $272,375 - $321,000
4
Beds
3
Baths
2,060
Sq Ft
$142/Sq Ft
Est. Value
About This Home
This home is located at 7028 N 5th St, McAllen, TX 78504 and is currently estimated at $292,594, approximately $142 per square foot. 7028 N 5th St is a home located in Hidalgo County with nearby schools including Gonzalez Elementary School, Cathey Middle School, and Memorial High School.
Ownership History
Date
Name
Owned For
Owner Type
Purchase Details
Closed on
Sep 11, 2025
Sold by
Chavez Dennis R and Chavez Cynthia A
Bought by
Dencyn Llc
Current Estimated Value
Purchase Details
Closed on
Feb 26, 2020
Sold by
J & Dmc Management Llc
Bought by
Martinez Luis Osvaldo
Home Financials for this Owner
Home Financials are based on the most recent Mortgage that was taken out on this home.
Original Mortgage
$49,662
Interest Rate
3.4%
Mortgage Type
Purchase Money Mortgage
Create a Home Valuation Report for This Property
The Home Valuation Report is an in-depth analysis detailing your home's value as well as a comparison with similar homes in the area
Home Values in the Area
Average Home Value in this Area
Purchase History
| Date | Buyer | Sale Price | Title Company |
|---|---|---|---|
| Dencyn Llc | -- | Corporation Service | |
| Martinez Luis Osvaldo | -- | None Available |
Source: Public Records
Mortgage History
| Date | Status | Borrower | Loan Amount |
|---|---|---|---|
| Previous Owner | Martinez Luis Osvaldo | $49,662 |
Source: Public Records
Tax History Compared to Growth
Tax History
| Year | Tax Paid | Tax Assessment Tax Assessment Total Assessment is a certain percentage of the fair market value that is determined by local assessors to be the total taxable value of land and additions on the property. | Land | Improvement |
|---|---|---|---|---|
| 2025 | $5,614 | $229,225 | $70,331 | $158,894 |
| 2024 | $5,614 | $238,660 | $64,898 | $173,762 |
| 2023 | $5,497 | $233,660 | $35,920 | $197,740 |
| 2022 | $5,062 | $204,139 | $35,920 | $168,219 |
| 2021 | $4,663 | $182,515 | $35,920 | $146,595 |
| 2020 | $4,357 | $170,781 | $35,920 | $134,861 |
| 2019 | $4,090 | $161,261 | $35,920 | $125,341 |
| 2018 | $4,337 | $170,696 | $43,768 | $126,928 |
| 2017 | $4,394 | $172,282 | $43,768 | $128,514 |
| 2016 | $4,475 | $175,455 | $43,768 | $131,687 |
| 2015 | $3,586 | $169,109 | $43,768 | $125,341 |
Source: Public Records
Map
Nearby Homes