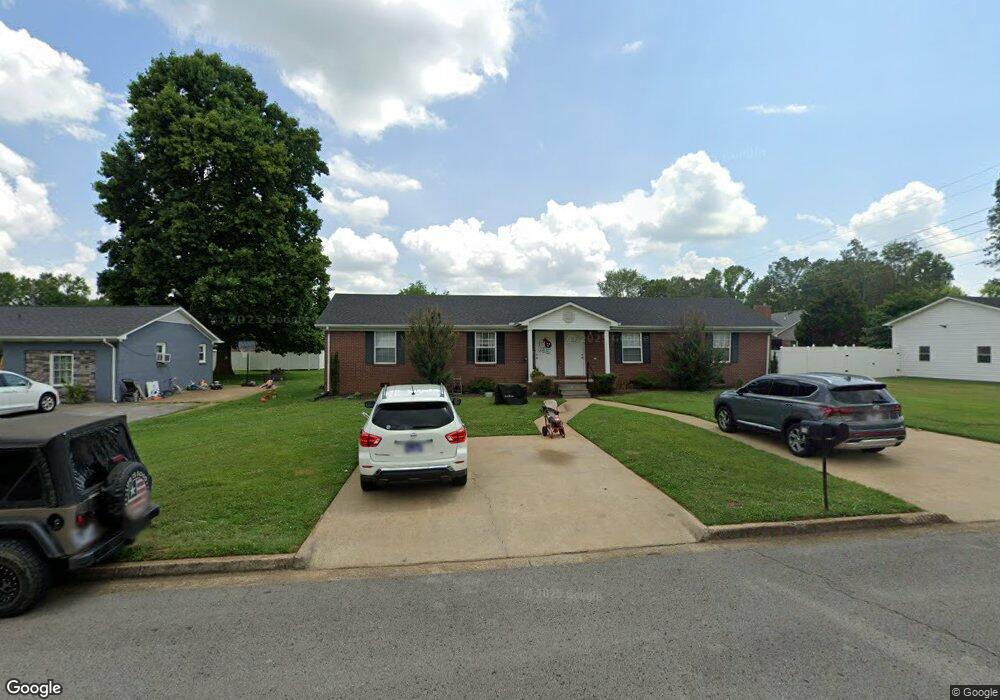
703 3rd St Lawrenceburg, TN 38464
Estimated Value: $213,000 - $296,000
--
Bed
2
Baths
1,890
Sq Ft
$130/Sq Ft
Est. Value
About This Home
This home is located at 703 3rd St, Lawrenceburg, TN 38464 and is currently estimated at $245,253, approximately $129 per square foot. 703 3rd St is a home located in Lawrence County with nearby schools including Ingram Sowell Elementary School, Lawrenceburg Public Elementary School, and David Crockett Elementary School.
Ownership History
Date
Name
Owned For
Owner Type
Purchase Details
Closed on
Aug 12, 2014
Sold by
Gobbell James E
Bought by
Jones Tyler L and Jones Tori E
Current Estimated Value
Home Financials for this Owner
Home Financials are based on the most recent Mortgage that was taken out on this home.
Original Mortgage
$107,025
Outstanding Balance
$80,626
Interest Rate
3.87%
Mortgage Type
FHA
Estimated Equity
$164,627
Purchase Details
Closed on
Sep 28, 2009
Sold by
Massey Wm
Bought by
Gobbell James E
Purchase Details
Closed on
Jun 25, 1996
Bought by
Massey Wm and Massey Wm
Purchase Details
Closed on
Nov 18, 1994
Bought by
Jones Thomas L and Jones Eulalia
Purchase Details
Closed on
Mar 28, 1978
Bought by
Jones Thomas L and Jones Eulalia
Purchase Details
Closed on
Apr 27, 1974
Create a Home Valuation Report for This Property
The Home Valuation Report is an in-depth analysis detailing your home's value as well as a comparison with similar homes in the area
Home Values in the Area
Average Home Value in this Area
Purchase History
| Date | Buyer | Sale Price | Title Company |
|---|---|---|---|
| Jones Tyler L | $109,000 | -- | |
| Gobbell James E | $105,000 | -- | |
| Massey Wm | $15,000 | -- | |
| Jones Thomas L | $800 | -- | |
| Jones Thomas L | -- | -- | |
| -- | -- | -- |
Source: Public Records
Mortgage History
| Date | Status | Borrower | Loan Amount |
|---|---|---|---|
| Open | Jones Tyler L | $107,025 |
Source: Public Records
Tax History Compared to Growth
Tax History
| Year | Tax Paid | Tax Assessment Tax Assessment Total Assessment is a certain percentage of the fair market value that is determined by local assessors to be the total taxable value of land and additions on the property. | Land | Improvement |
|---|---|---|---|---|
| 2025 | $1,309 | $42,125 | $0 | $0 |
| 2024 | $1,309 | $42,125 | $3,750 | $38,375 |
| 2023 | $1,309 | $42,125 | $3,750 | $38,375 |
| 2022 | $1,309 | $42,125 | $3,750 | $38,375 |
| 2021 | $1,062 | $24,150 | $2,500 | $21,650 |
| 2020 | $1,062 | $24,150 | $2,500 | $21,650 |
| 2019 | $1,062 | $24,150 | $2,500 | $21,650 |
| 2018 | $1,062 | $24,150 | $2,500 | $21,650 |
| 2017 | $1,062 | $24,150 | $2,500 | $21,650 |
| 2016 | $1,062 | $24,150 | $2,500 | $21,650 |
| 2015 | $1,005 | $24,150 | $2,500 | $21,650 |
| 2014 | $1,001 | $24,050 | $2,500 | $21,550 |
Source: Public Records
Map
Nearby Homes