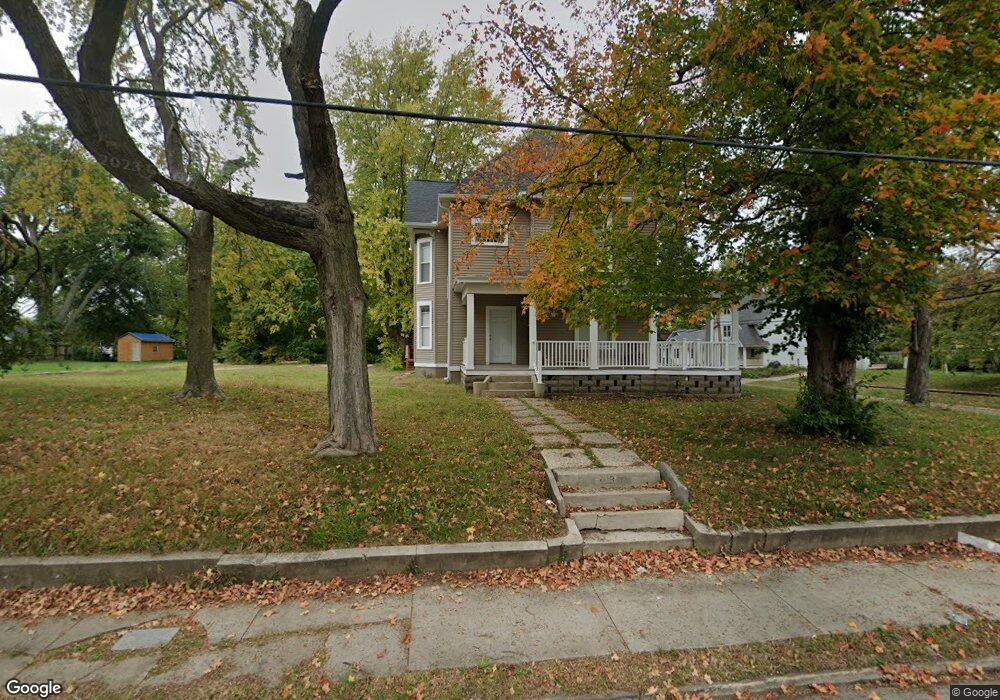
703 S Main St Jacksonville, IL 62650
Estimated Value: $83,000 - $121,000
--
Bed
--
Bath
--
Sq Ft
6,098
Sq Ft Lot
About This Home
This home is located at 703 S Main St, Jacksonville, IL 62650 and is currently estimated at $108,629. 703 S Main St is a home located in Morgan County with nearby schools including Jacksonville High School, Salem Lutheran School, and Salem Lutheran School.
Ownership History
Date
Name
Owned For
Owner Type
Purchase Details
Closed on
Aug 20, 2025
Sold by
Campbell Chris and Campbell Paige
Bought by
Glover Debra K
Current Estimated Value
Home Financials for this Owner
Home Financials are based on the most recent Mortgage that was taken out on this home.
Original Mortgage
$109,890
Outstanding Balance
$109,783
Interest Rate
6.13%
Mortgage Type
FHA
Estimated Equity
-$1,154
Purchase Details
Closed on
Aug 29, 2007
Sold by
United Community Bank
Bought by
Campbell Chris and Campbell Paige
Home Financials for this Owner
Home Financials are based on the most recent Mortgage that was taken out on this home.
Original Mortgage
$27,900
Interest Rate
6.72%
Mortgage Type
New Conventional
Purchase Details
Closed on
Apr 29, 2005
Sold by
Williamson Randy S and Williamson Connie A
Bought by
United Community Bank
Create a Home Valuation Report for This Property
The Home Valuation Report is an in-depth analysis detailing your home's value as well as a comparison with similar homes in the area
Home Values in the Area
Average Home Value in this Area
Purchase History
| Date | Buyer | Sale Price | Title Company |
|---|---|---|---|
| Glover Debra K | $40,000 | None Listed On Document | |
| Campbell Chris | $31,000 | None Available | |
| United Community Bank | -- | None Available |
Source: Public Records
Mortgage History
| Date | Status | Borrower | Loan Amount |
|---|---|---|---|
| Open | Glover Debra K | $109,890 | |
| Previous Owner | Campbell Chris | $27,900 |
Source: Public Records
Tax History Compared to Growth
Tax History
| Year | Tax Paid | Tax Assessment Tax Assessment Total Assessment is a certain percentage of the fair market value that is determined by local assessors to be the total taxable value of land and additions on the property. | Land | Improvement |
|---|---|---|---|---|
| 2024 | $1,592 | $18,290 | $2,340 | $15,950 |
| 2023 | $1,623 | $17,220 | $2,340 | $14,880 |
| 2022 | $1,760 | $18,470 | $2,340 | $16,130 |
| 2021 | $1,724 | $18,480 | $3,210 | $15,270 |
| 2020 | $1,760 | $18,480 | $3,210 | $15,270 |
| 2019 | $1,746 | $18,480 | $3,210 | $15,270 |
| 2018 | $1,684 | $18,480 | $3,210 | $15,270 |
| 2017 | $1,718 | $19,280 | $3,210 | $16,070 |
| 2016 | $1,736 | $19,280 | $3,210 | $16,070 |
| 2015 | $1,715 | $18,720 | $3,120 | $15,600 |
| 2014 | $1,715 | $18,720 | $3,120 | $15,600 |
| 2013 | $1,618 | $18,720 | $3,120 | $15,600 |
Source: Public Records
Map
Nearby Homes
- 800 S Main St
- 333 Kentucky St
- 227 Anna St
- 352 Franklin St
- 440 S Sandy St
- 900 Bibbs St
- 209 E Beecher Ave
- 203 W Beecher Ave
- 401 S East St
- 406 S East St
- None None St
- 727 Hardin Ave
- 544 Hardin Ave
- 216 S Church St
- 507 S Prairie St
- 400 W Morgan St
- 506 S Diamond St
- 839 Grove St
- 314 W Douglas Ave
- 232 Westminster St
- 709 S Main St
- 123 W Chambers St
- 713 S Main St
- 613 S Main St
- 125 W Chambers St
- 126 W Chambers St
- 715 S Main St
- 127 W Chambers St
- 704 S Main St
- 128 W Chambers St
- 607 S Main St
- 716 S Main St
- 614 S Main St
- 708 S Main St
- 134 W Chambers St
- 131 W Chambers St
- 807 S Main St
- 608 S Main St
- 150 Kentucky St
- 118 E Chambers St