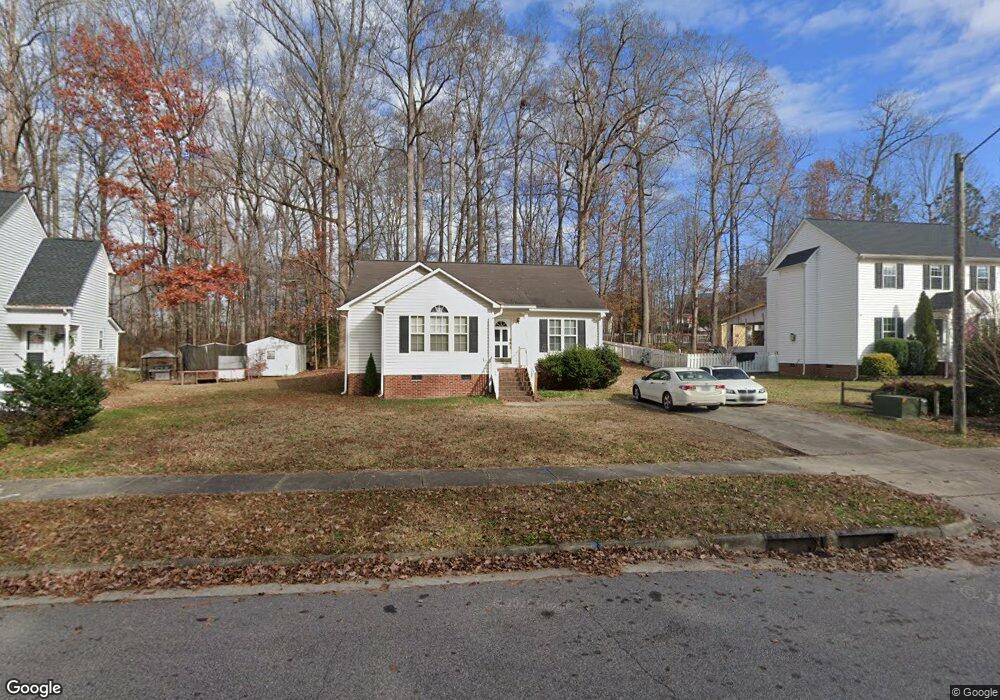
704 Southampton Dr Knightdale, NC 27545
Estimated Value: $279,000 - $318,522
3
Beds
2
Baths
1,211
Sq Ft
$252/Sq Ft
Est. Value
About This Home
This home is located at 704 Southampton Dr, Knightdale, NC 27545 and is currently estimated at $304,881, approximately $251 per square foot. 704 Southampton Dr is a home located in Wake County with nearby schools including Knightdale Elementary School, Neuse River Middle School, and Knightdale High.
Ownership History
Date
Name
Owned For
Owner Type
Purchase Details
Closed on
Oct 22, 2013
Sold by
Tilley Christopher and Tilley April
Bought by
Parody Randy J
Current Estimated Value
Home Financials for this Owner
Home Financials are based on the most recent Mortgage that was taken out on this home.
Original Mortgage
$129,510
Outstanding Balance
$95,862
Interest Rate
4.12%
Mortgage Type
FHA
Estimated Equity
$209,019
Purchase Details
Closed on
Oct 26, 2006
Sold by
Stott C Raymond
Bought by
Tilley April and Tilley Christopher
Home Financials for this Owner
Home Financials are based on the most recent Mortgage that was taken out on this home.
Original Mortgage
$131,000
Interest Rate
6.25%
Mortgage Type
Purchase Money Mortgage
Purchase Details
Closed on
Oct 16, 2000
Sold by
Spectrum Homes Inc
Bought by
Stott C Raymond
Home Financials for this Owner
Home Financials are based on the most recent Mortgage that was taken out on this home.
Original Mortgage
$75,000
Interest Rate
7.96%
Create a Home Valuation Report for This Property
The Home Valuation Report is an in-depth analysis detailing your home's value as well as a comparison with similar homes in the area
Home Values in the Area
Average Home Value in this Area
Purchase History
| Date | Buyer | Sale Price | Title Company |
|---|---|---|---|
| Parody Randy J | $132,000 | None Available | |
| Tilley April | $131,000 | None Available | |
| Stott C Raymond | $119,000 | -- |
Source: Public Records
Mortgage History
| Date | Status | Borrower | Loan Amount |
|---|---|---|---|
| Open | Parody Randy J | $129,510 | |
| Previous Owner | Tilley April | $131,000 | |
| Previous Owner | Stott C Raymond | $75,000 |
Source: Public Records
Tax History Compared to Growth
Tax History
| Year | Tax Paid | Tax Assessment Tax Assessment Total Assessment is a certain percentage of the fair market value that is determined by local assessors to be the total taxable value of land and additions on the property. | Land | Improvement |
|---|---|---|---|---|
| 2025 | $2,655 | $275,265 | $85,000 | $190,265 |
| 2024 | $2,645 | $275,265 | $85,000 | $190,265 |
| 2023 | $1,916 | $171,235 | $38,000 | $133,235 |
| 2022 | $1,851 | $171,235 | $38,000 | $133,235 |
| 2021 | $1,767 | $171,235 | $38,000 | $133,235 |
| 2020 | $1,767 | $171,235 | $38,000 | $133,235 |
| 2019 | $1,625 | $139,513 | $38,000 | $101,513 |
| 2018 | $1,533 | $139,513 | $38,000 | $101,513 |
| 2017 | $1,478 | $139,513 | $38,000 | $101,513 |
| 2016 | $1,458 | $139,513 | $38,000 | $101,513 |
| 2015 | $1,426 | $134,587 | $37,000 | $97,587 |
| 2014 | $1,377 | $134,587 | $37,000 | $97,587 |
Source: Public Records
Map
Nearby Homes
- 104 Saint Johns St
- 216 Walbury Dr
- 413 Laurens Way
- 302 Brakeman St
- 117 Stanway Dr
- 619 Laurens Way
- 506 Sternwheel Way
- 102 Switchback St
- 116 Carrington Dr
- 1442 Jay Rd
- 1452 Jay Rd
- 1500 Wader Cir
- 1456 Jay Rd
- 1516 Wader Cir
- 1463 Jay Rd
- 1448 Jay Rd
- 1700 Goldfinch Perch Ln
- 1580 Goldfinch Perch Ln
- 444 Haywood Glen Dr
- 1512 Wader Cir
- 702 Southampton Dr
- 706 Southampton Dr
- 604 Southampton Dr
- 306 Walbury Dr
- 308 Walbury Dr
- 304 Walbury Dr
- 310 Walbury Dr
- 705 Southampton Dr
- 302 Walbury Dr
- 602 Southampton Dr
- 312 Walbury Dr
- 707 Southampton Dr
- 305 Walbury Dr
- 1001 Gallows Way
- 307 Walbury Dr
- 303 Walbury Dr
- 228 Walbury Dr
- 512 Southampton Dr
- 1003 Gallows Way
- 603 Southampton Dr