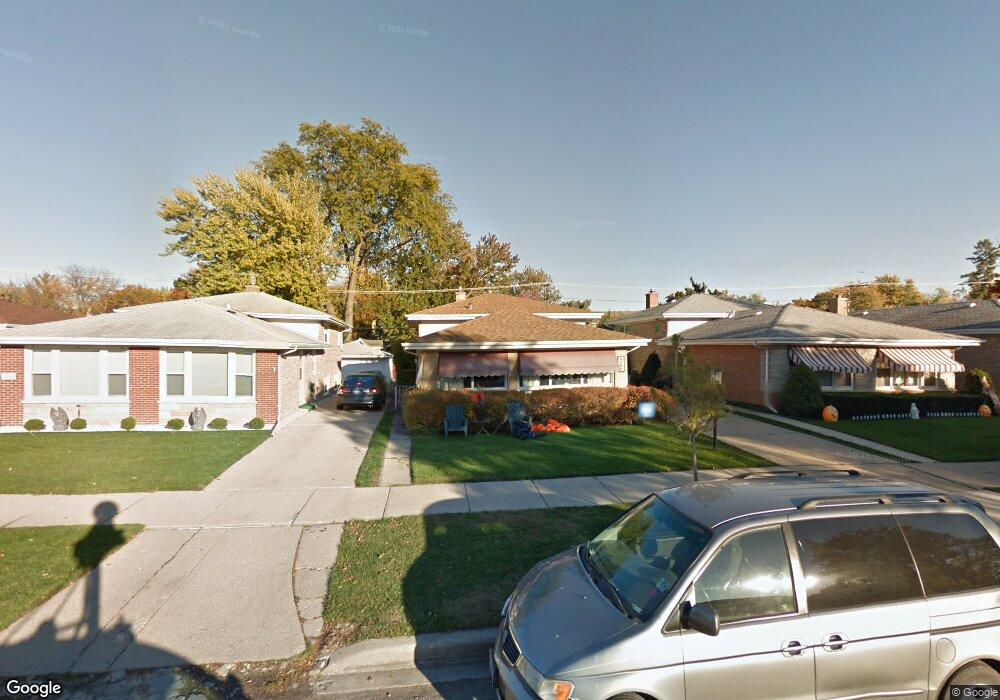
7045 N Ottawa Ave Chicago, IL 60631
Edison Park NeighborhoodEstimated Value: $475,888 - $539,000
3
Beds
2
Baths
1,310
Sq Ft
$387/Sq Ft
Est. Value
About This Home
This home is located at 7045 N Ottawa Ave, Chicago, IL 60631 and is currently estimated at $506,472, approximately $386 per square foot. 7045 N Ottawa Ave is a home located in Cook County with nearby schools including Ebinger Elementary School, William Howard Taft High School, and St. Juliana School.
Ownership History
Date
Name
Owned For
Owner Type
Purchase Details
Closed on
Feb 25, 2013
Sold by
Brady And Associates Inc
Bought by
Donlin Jennifer Nykiel and Donlin Nolan
Current Estimated Value
Home Financials for this Owner
Home Financials are based on the most recent Mortgage that was taken out on this home.
Original Mortgage
$299,475
Outstanding Balance
$210,948
Interest Rate
3.5%
Mortgage Type
FHA
Estimated Equity
$295,524
Purchase Details
Closed on
Dec 10, 2007
Sold by
Brady Michael I
Bought by
Brady & Associates Inc
Home Financials for this Owner
Home Financials are based on the most recent Mortgage that was taken out on this home.
Original Mortgage
$452,000
Interest Rate
7.5%
Mortgage Type
Unknown
Purchase Details
Closed on
Jul 27, 2006
Sold by
Chicago Title Land Trust Co
Bought by
Brady Michael I
Create a Home Valuation Report for This Property
The Home Valuation Report is an in-depth analysis detailing your home's value as well as a comparison with similar homes in the area
Home Values in the Area
Average Home Value in this Area
Purchase History
| Date | Buyer | Sale Price | Title Company |
|---|---|---|---|
| Donlin Jennifer Nykiel | $305,000 | None Available | |
| Brady & Associates Inc | -- | None Available | |
| Brady Michael I | $475,000 | First American Title |
Source: Public Records
Mortgage History
| Date | Status | Borrower | Loan Amount |
|---|---|---|---|
| Open | Donlin Jennifer Nykiel | $299,475 | |
| Previous Owner | Brady & Associates Inc | $452,000 |
Source: Public Records
Tax History Compared to Growth
Tax History
| Year | Tax Paid | Tax Assessment Tax Assessment Total Assessment is a certain percentage of the fair market value that is determined by local assessors to be the total taxable value of land and additions on the property. | Land | Improvement |
|---|---|---|---|---|
| 2024 | $7,807 | $40,001 | $13,333 | $26,668 |
| 2023 | $7,610 | $37,000 | $10,666 | $26,334 |
| 2022 | $7,610 | $37,000 | $10,666 | $26,334 |
| 2021 | $7,440 | $37,000 | $10,666 | $26,334 |
| 2020 | $7,944 | $35,661 | $7,199 | $28,462 |
| 2019 | $7,961 | $39,624 | $7,199 | $32,425 |
| 2018 | $7,827 | $39,624 | $7,199 | $32,425 |
| 2017 | $7,007 | $32,551 | $6,399 | $26,152 |
| 2016 | $6,520 | $32,551 | $6,399 | $26,152 |
| 2015 | $5,965 | $32,551 | $6,399 | $26,152 |
| 2014 | $4,919 | $26,511 | $5,333 | $21,178 |
| 2013 | $4,822 | $26,511 | $5,333 | $21,178 |
Source: Public Records
Map
Nearby Homes
- 7101 N Ottawa Ave
- 6919 N Overhill Ave
- 7005 N Osceola Ave
- 7215 N Olcott Ave
- 7255 N Oriole Ave
- 6841 N Northwest Hwy Unit 3C
- 6852 N Northwest Hwy Unit 2B
- 460 S Northwest Hwy Unit 307A
- 7324 W Lunt Ave
- 400 S Northwest Hwy Unit 312B
- 7315 W Lunt Ave
- 6815 N Olmsted Ave Unit 203
- 6681 N Northwest Hwy
- 7404 N Overhill Ave
- 7314 N Odell Ave
- 7221 N Octavia Ave
- 6727 N Oketo Ave
- 7422 N Olcott Ave
- 7441 N Oriole Ave
- 7357 N Oketo Ave
- 7049 N Ottawa Ave
- 7041 N Ottawa Ave
- 7055 N Ottawa Ave
- 7035 N Ottawa Ave
- 7042 N Oriole Ave
- 7044 N Oriole Ave
- 7040 N Oriole Ave
- 7048 N Oriole Ave
- 7034 N Oriole Ave
- 7050 N Oriole Ave
- 7031 N Ottawa Ave
- 7030 N Oriole Ave
- 7042 N Ottawa Ave
- 7030 N Ottawa Ave
- 7058 N Oriole Ave
- 7046 N Ottawa Ave
- 7050 N Ottawa Ave
- 7028 N Oriole Ave
- 7105 N Ottawa Ave
- 7054 N Ottawa Ave