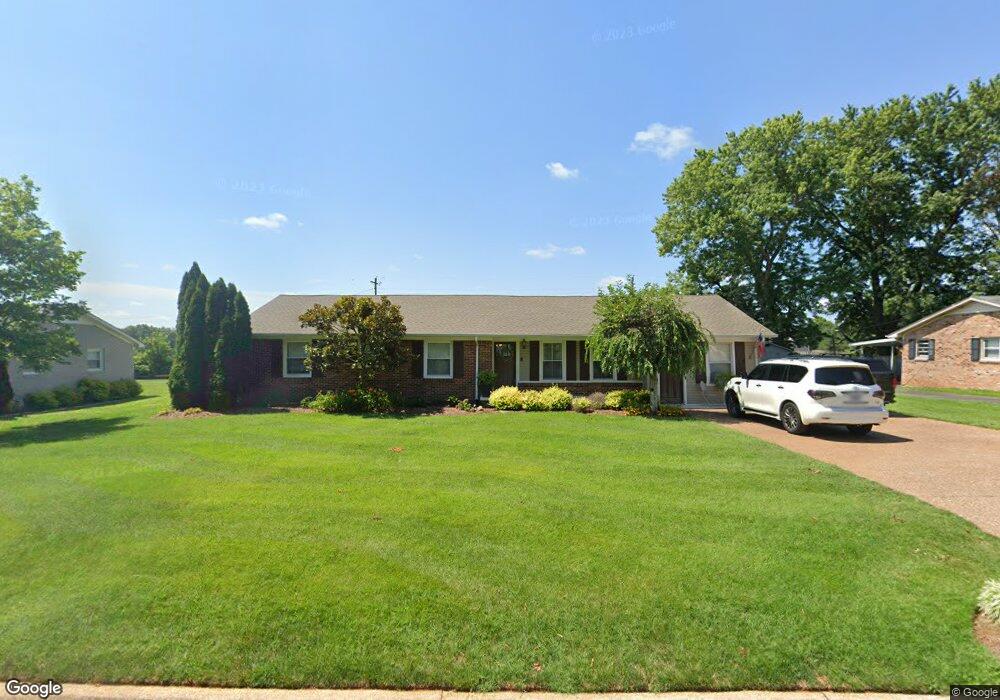
705 Lloyd St Lawrenceburg, TN 38464
Estimated Value: $211,895 - $269,000
--
Bed
2
Baths
1,848
Sq Ft
$135/Sq Ft
Est. Value
About This Home
This home is located at 705 Lloyd St, Lawrenceburg, TN 38464 and is currently estimated at $250,224, approximately $135 per square foot. 705 Lloyd St is a home located in Lawrence County with nearby schools including Ingram Sowell Elementary School, Lawrenceburg Public Elementary School, and David Crockett Elementary School.
Ownership History
Date
Name
Owned For
Owner Type
Purchase Details
Closed on
Jun 3, 2011
Sold by
Snider Brandon Wade
Bought by
Berryhill Noah Brock and Berryhill Betsy
Current Estimated Value
Purchase Details
Closed on
Aug 12, 2005
Sold by
Eledge William J
Bought by
Orten James D
Purchase Details
Closed on
Jun 22, 2004
Bought by
Wilson Dorothy J and Snider Brandon Wade
Purchase Details
Closed on
Apr 16, 1991
Bought by
Wilson Andrew D and Wilson Dorothy
Purchase Details
Closed on
Jan 3, 1990
Bought by
Wilson Andrew D and Wilson Dorothy
Purchase Details
Closed on
Oct 26, 1987
Bought by
Wilson Andrew D and Wilson Dorothy
Purchase Details
Closed on
Aug 24, 1982
Bought by
Faile Ronald J and Faile Edna B
Purchase Details
Closed on
Jan 1, 1982
Purchase Details
Closed on
Apr 4, 1972
Create a Home Valuation Report for This Property
The Home Valuation Report is an in-depth analysis detailing your home's value as well as a comparison with similar homes in the area
Home Values in the Area
Average Home Value in this Area
Purchase History
| Date | Buyer | Sale Price | Title Company |
|---|---|---|---|
| Berryhill Noah Brock | $100,000 | -- | |
| Orten James D | $22,000 | -- | |
| Wilson Dorothy J | -- | -- | |
| Wilson Andrew D | $46,000 | -- | |
| Wilson Andrew D | -- | -- | |
| Wilson Andrew D | $46,000 | -- | |
| Faile Ronald J | -- | -- | |
| -- | -- | -- | |
| -- | -- | -- |
Source: Public Records
Tax History Compared to Growth
Tax History
| Year | Tax Paid | Tax Assessment Tax Assessment Total Assessment is a certain percentage of the fair market value that is determined by local assessors to be the total taxable value of land and additions on the property. | Land | Improvement |
|---|---|---|---|---|
| 2025 | $1,174 | $37,775 | $0 | $0 |
| 2024 | $1,174 | $37,775 | $3,125 | $34,650 |
| 2023 | $1,174 | $37,775 | $3,125 | $34,650 |
| 2022 | $1,174 | $37,775 | $3,125 | $34,650 |
| 2021 | $939 | $21,375 | $2,500 | $18,875 |
| 2020 | $939 | $21,375 | $2,500 | $18,875 |
| 2019 | $939 | $21,375 | $2,500 | $18,875 |
| 2018 | $939 | $21,375 | $2,500 | $18,875 |
| 2017 | $939 | $21,375 | $2,500 | $18,875 |
| 2016 | $939 | $21,375 | $2,500 | $18,875 |
| 2015 | $890 | $21,375 | $2,500 | $18,875 |
| 2014 | $852 | $20,475 | $2,500 | $17,975 |
Source: Public Records
Map
Nearby Homes