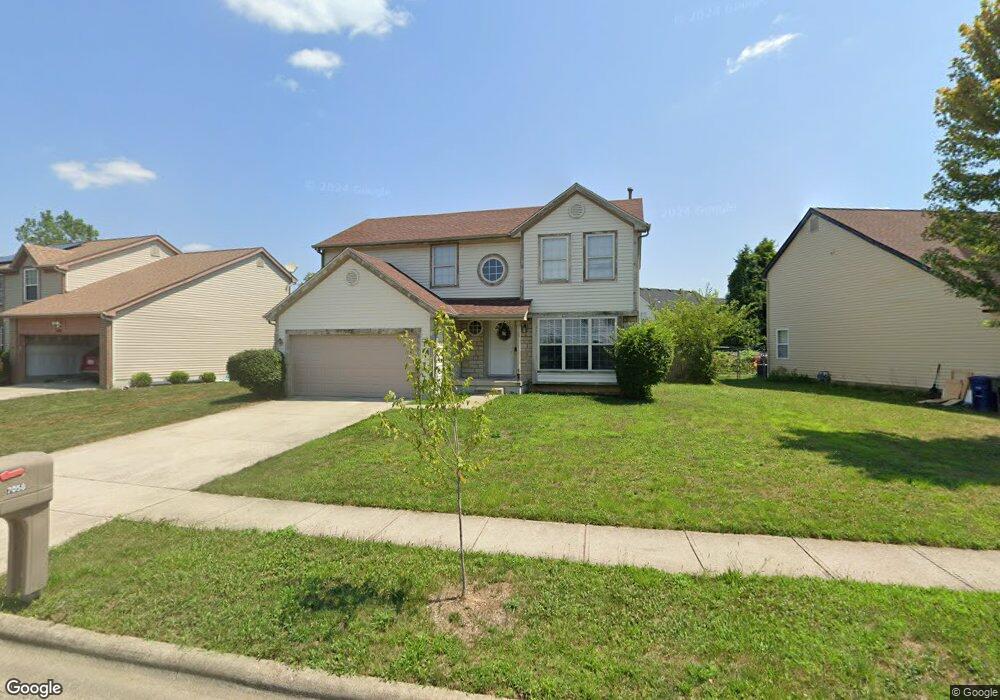
7058 Havencroft Dr Reynoldsburg, OH 43068
Estimated Value: $308,000 - $396,000
4
Beds
3
Baths
2,096
Sq Ft
$170/Sq Ft
Est. Value
About This Home
This home is located at 7058 Havencroft Dr, Reynoldsburg, OH 43068 and is currently estimated at $355,823, approximately $169 per square foot. 7058 Havencroft Dr is a home located in Fairfield County with nearby schools including Tussing Elementary School, Harmon Middle School, and Pickerington Ridgeview Junior High School.
Ownership History
Date
Name
Owned For
Owner Type
Purchase Details
Closed on
Dec 2, 2011
Sold by
Guzman Ramon
Bought by
Campbell Noni E
Current Estimated Value
Home Financials for this Owner
Home Financials are based on the most recent Mortgage that was taken out on this home.
Original Mortgage
$103,575
Outstanding Balance
$73,319
Interest Rate
4.75%
Mortgage Type
FHA
Estimated Equity
$282,504
Purchase Details
Closed on
Jan 25, 2008
Sold by
Burney Mixay S and Burney Christopher
Bought by
Guzman Ramon
Home Financials for this Owner
Home Financials are based on the most recent Mortgage that was taken out on this home.
Original Mortgage
$137,413
Interest Rate
6.1%
Mortgage Type
FHA
Purchase Details
Closed on
Dec 4, 2002
Sold by
Homewood Corp
Bought by
Burney Mixay and Sorasin Pheng
Home Financials for this Owner
Home Financials are based on the most recent Mortgage that was taken out on this home.
Original Mortgage
$182,300
Interest Rate
6.38%
Mortgage Type
FHA
Create a Home Valuation Report for This Property
The Home Valuation Report is an in-depth analysis detailing your home's value as well as a comparison with similar homes in the area
Home Values in the Area
Average Home Value in this Area
Purchase History
| Date | Buyer | Sale Price | Title Company |
|---|---|---|---|
| Campbell Noni E | $102,000 | Valmer Land Title Agency Box | |
| Guzman Ramon | $138,500 | Premiere Title Agency | |
| Burney Mixay | $185,234 | -- |
Source: Public Records
Mortgage History
| Date | Status | Borrower | Loan Amount |
|---|---|---|---|
| Open | Campbell Noni E | $103,575 | |
| Previous Owner | Guzman Ramon | $137,413 | |
| Previous Owner | Burney Mixay | $182,300 |
Source: Public Records
Tax History Compared to Growth
Tax History
| Year | Tax Paid | Tax Assessment Tax Assessment Total Assessment is a certain percentage of the fair market value that is determined by local assessors to be the total taxable value of land and additions on the property. | Land | Improvement |
|---|---|---|---|---|
| 2024 | $9,304 | $94,500 | $15,770 | $78,730 |
| 2023 | $3,676 | $94,500 | $15,770 | $78,730 |
| 2022 | $3,686 | $94,500 | $15,770 | $78,730 |
| 2021 | $3,275 | $72,480 | $12,130 | $60,350 |
| 2020 | $3,311 | $72,480 | $12,130 | $60,350 |
| 2019 | $3,335 | $72,480 | $12,130 | $60,350 |
| 2018 | $2,890 | $56,480 | $11,120 | $45,360 |
| 2017 | $2,893 | $55,470 | $10,110 | $45,360 |
| 2016 | $2,870 | $55,470 | $10,110 | $45,360 |
| 2015 | $2,744 | $50,410 | $10,110 | $40,300 |
| 2014 | $2,702 | $50,410 | $10,110 | $40,300 |
| 2013 | $2,702 | $50,410 | $10,110 | $40,300 |
Source: Public Records
Map
Nearby Homes
- 3265 O'Heagra Dr
- 3292 Draycott Ct
- 6926 Bennell Dr
- 3099 Ambarwent Rd
- 3072 Bocastle Ct
- 3188 Creighton Place
- 7287 Candlestone Dr
- 3124 Creighton Place
- 3358 Cargin Ct
- 3205 Mahaffey Ct
- 3021 Sumner Dr
- 3233 Mahaffey Ct
- 3212 Southern Hills Dr
- 3133 Earlington Ln
- 7350 Aplin Dr
- 3161 Innisbrook Ct
- 6775 Centennial Dr
- 3624 Peany Ln
- 6800 Barker Dr
- 3535 Wheatfield Dr
- 7050 Havencroft Dr
- 7074 Havencroft Dr
- 7053 Winnow Ct
- 7053 Winnow Ct
- 7042 Havencroft Dr
- 7090 Havencroft Dr
- 6927 Idlelea Dr
- 7059 Winnow Ct
- 7056 Winnow Ct
- 6930 Jacquard Ct
- 7034 Havencroft Dr
- 7106 Havencroft Dr
- 6926 Idelea Dr
- 6926 Idlelea Dr
- 7065 Winnow Ct
- 7062 Winnow Ct
- 6918 Jacquard Ct
- 6920 Idlelea Dr
- 6915 Idledea Dr
- 6915 Idlelea Dr