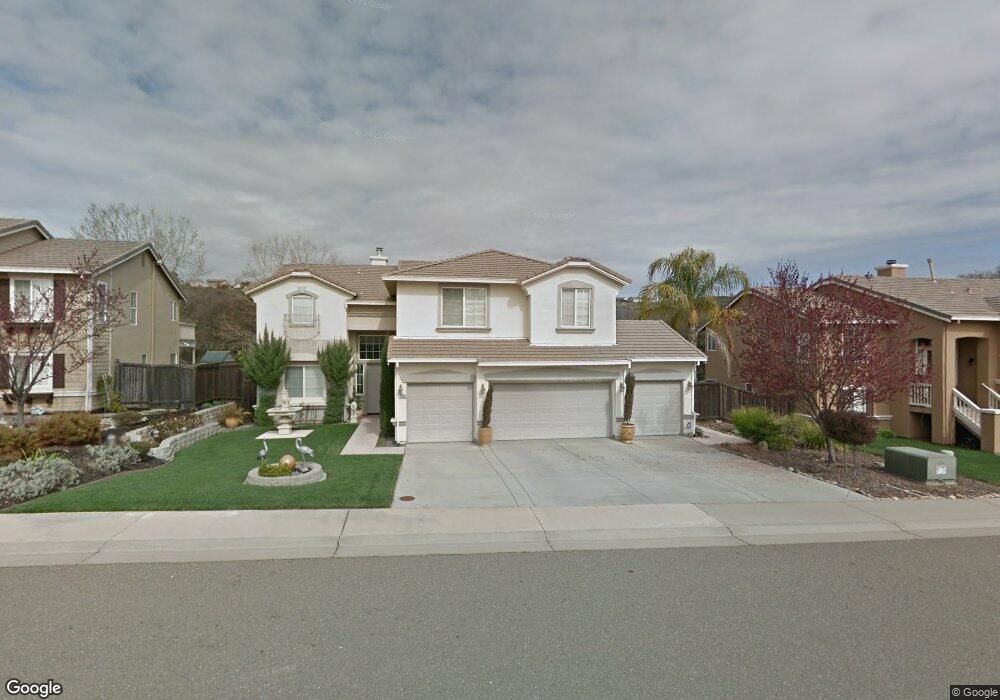
7059 Cinnamon Teal Way El Dorado Hills, CA 95762
Estimated Value: $744,000 - $1,021,000
5
Beds
3
Baths
3,786
Sq Ft
$238/Sq Ft
Est. Value
About This Home
This home is located at 7059 Cinnamon Teal Way, El Dorado Hills, CA 95762 and is currently estimated at $902,608, approximately $238 per square foot. 7059 Cinnamon Teal Way is a home located in El Dorado County with nearby schools including Green Valley Elementary School, Pleasant Grove Middle School, and Ponderosa High School.
Ownership History
Date
Name
Owned For
Owner Type
Purchase Details
Closed on
Jan 10, 2018
Sold by
Estes John Thomas and Estes Tamara
Bought by
Estes John T and Estes Tamara
Current Estimated Value
Purchase Details
Closed on
Aug 15, 2009
Sold by
Estes John Thomas and The Fleck Trust
Bought by
Estes John Thomas and Estes Tamara
Purchase Details
Closed on
Jul 1, 2004
Sold by
Prudential Residential Services Lp
Bought by
Fleck Gladys Julia and Fleck Trust
Purchase Details
Closed on
Jun 26, 2004
Sold by
Tanzi Franco and Tanzi Cosima Pia
Bought by
Prudential Residential Services Lp and Prudential Homes Corp
Purchase Details
Closed on
Apr 29, 2002
Sold by
Bass Lake Llc
Bought by
Tanzi Franco and Tanzi Cosima Pia
Home Financials for this Owner
Home Financials are based on the most recent Mortgage that was taken out on this home.
Original Mortgage
$210,700
Interest Rate
7.08%
Create a Home Valuation Report for This Property
The Home Valuation Report is an in-depth analysis detailing your home's value as well as a comparison with similar homes in the area
Home Values in the Area
Average Home Value in this Area
Purchase History
| Date | Buyer | Sale Price | Title Company |
|---|---|---|---|
| Estes John T | -- | None Available | |
| Estes John Thomas | -- | None Available | |
| Fleck Gladys Julia | $675,000 | Fidelity Natl Title Co | |
| Prudential Residential Services Lp | $675,000 | Fidelity Natl Title Co | |
| Tanzi Franco | $395,500 | First American Title Ins Co |
Source: Public Records
Mortgage History
| Date | Status | Borrower | Loan Amount |
|---|---|---|---|
| Previous Owner | Tanzi Franco | $210,700 |
Source: Public Records
Tax History Compared to Growth
Tax History
| Year | Tax Paid | Tax Assessment Tax Assessment Total Assessment is a certain percentage of the fair market value that is determined by local assessors to be the total taxable value of land and additions on the property. | Land | Improvement |
|---|---|---|---|---|
| 2025 | $7,123 | $645,393 | $129,072 | $516,321 |
| 2024 | $7,123 | $632,740 | $126,542 | $506,198 |
| 2023 | $6,687 | $620,334 | $124,061 | $496,273 |
| 2022 | $6,596 | $608,172 | $121,629 | $486,543 |
| 2021 | $6,579 | $596,248 | $119,245 | $477,003 |
| 2020 | $6,521 | $590,135 | $118,023 | $472,112 |
| 2019 | $6,399 | $578,564 | $115,709 | $462,855 |
| 2018 | $6,179 | $567,221 | $113,441 | $453,780 |
| 2017 | $6,085 | $556,100 | $111,217 | $444,883 |
| 2016 | $6,000 | $545,197 | $109,037 | $436,160 |
| 2015 | $5,849 | $537,009 | $107,400 | $429,609 |
| 2014 | $5,849 | $526,493 | $105,298 | $421,195 |
Source: Public Records
Map
Nearby Homes
- 4004 Prairie Falcon Dr
- 7111 Cinnamon Teal Way
- 7137 Cinnamon Teal Way
- 423 Oeste Ln
- 3180 Woodleigh Ln
- 3341 Rancho Tierra Ct
- 2871 Vista Verde Dr
- 3182 Birmingham Way
- 4066 Plateau Cir
- 2940 Pasada Rd
- 3271 Woodleigh Ln
- 2960 Pasada Rd
- 0 Wilkinson Rd
- 0 Wilkinson Rd
- 3538 Chelsea Rd
- 3021 Robles Ct
- 5510 Crimson Ct
- 5505 Crimson Ct
- 2980 Calido Ct
- 2541 Knollwood Dr
- 7065 Cinnamon Teal Way
- 7053 Cinnamon Teal Way
- 7071 Cinnamon Teal Way
- 7047 Cinnamon Teal Way
- 7060 Cinnamon Teal Way
- 7054 Cinnamon Teal Way
- 7066 Cinnamon Teal Way
- 7048 Cinnamon Teal Way
- 7041 Cinnamon Teal Way
- 7077 Cinnamon Teal Way
- 7072 Cinnamon Teal Way
- 7042 Cinnamon Teal Way
- 2279 Summer Dr
- 2285 Summer Dr
- 8048 Peach Spruce Dr
- 7080 Cinnamon Teal Way
- 2291 Summer Dr
- 7083 Cinnamon Teal Way
- 2267 Summer Dr
- 9074 Orchid Shade Dr