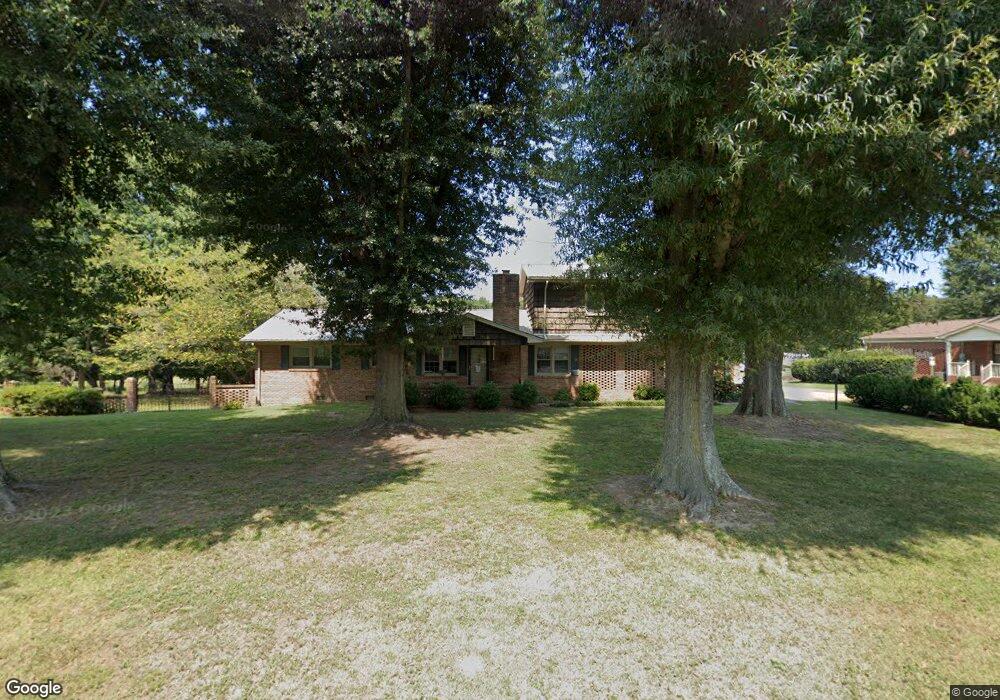
706 Bethlehem Church Rd Kings Mountain, NC 28086
Estimated Value: $288,408 - $521,000
--
Bed
--
Bath
2,642
Sq Ft
$144/Sq Ft
Est. Value
About This Home
This home is located at 706 Bethlehem Church Rd, Kings Mountain, NC 28086 and is currently estimated at $380,102, approximately $143 per square foot. 706 Bethlehem Church Rd is a home located in Cleveland County with nearby schools including Bethware Elementary School, Kings Mountain Middle, and Kings Mountain Intermediate School.
Create a Home Valuation Report for This Property
The Home Valuation Report is an in-depth analysis detailing your home's value as well as a comparison with similar homes in the area
Home Values in the Area
Average Home Value in this Area
Tax History Compared to Growth
Tax History
| Year | Tax Paid | Tax Assessment Tax Assessment Total Assessment is a certain percentage of the fair market value that is determined by local assessors to be the total taxable value of land and additions on the property. | Land | Improvement |
|---|---|---|---|---|
| 2025 | $1,815 | $285,759 | $29,204 | $256,555 |
| 2024 | $1,460 | $180,492 | $22,389 | $158,103 |
| 2023 | $1,453 | $180,492 | $22,389 | $158,103 |
| 2022 | $1,453 | $180,492 | $22,389 | $158,103 |
| 2021 | $1,460 | $180,492 | $22,389 | $158,103 |
| 2020 | $1,335 | $152,450 | $22,389 | $130,061 |
| 2019 | $1,335 | $152,450 | $22,389 | $130,061 |
| 2018 | $1,331 | $152,450 | $22,389 | $130,061 |
| 2017 | $1,324 | $152,450 | $22,389 | $130,061 |
| 2016 | $1,266 | $152,450 | $22,389 | $130,061 |
| 2015 | $1,264 | $152,170 | $14,602 | $137,568 |
| 2014 | $1,264 | $152,170 | $14,602 | $137,568 |
Source: Public Records
Map
Nearby Homes
- 707 Sandalwood Ln
- 716 Mcdaniel Rd
- 907 Bethlehem Rd
- 813 Bethlehem Rd
- 802 Bethlehem Rd Unit 5
- 000 Bethlehem Rd
- 411 El Bethel Rd
- 215 Chadwick Dr
- 400 El Bethel Rd
- 107 Tara Terrace
- 131 Sam Smith Dr
- 310 Yarbro Rd
- 1425 Bethlehem Rd
- 143 Yarbro Rd Unit 2
- 107 Connor Ct
- 132 Yarbro Rd Unit 17
- 132 Yarbro Rd Unit 13
- 507 Bethlehem Rd
- 11111 High Ridge Ct Unit 11
- 114 Yarbro Rd Unit 23
- 702 Bethlehem Church Rd
- 710 Bethlehem Church Rd
- 707 Bethlehem Church Rd
- 606 Bethlehem Church Rd
- 101 Trotter Ln
- 103 Trotter Ln
- 716 Bethlehem Church Rd
- 607 Bethlehem Church Rd
- 713 Bethlehem Church Rd
- 708 Sandalwood Ln
- 706 Sandalwood Ln
- 704 Sandalwood Ln
- 710 Sandalwood Ln
- 904 Blalock Dr
- 826 Bethlehem Rd
- 715 Bethlehem Church Rd Unit 25
- 715 Bethlehem Rd
- 704 Bethlehem Church Rd
- 105 Trotter Ln
- 605 Bethlehem Church Rd