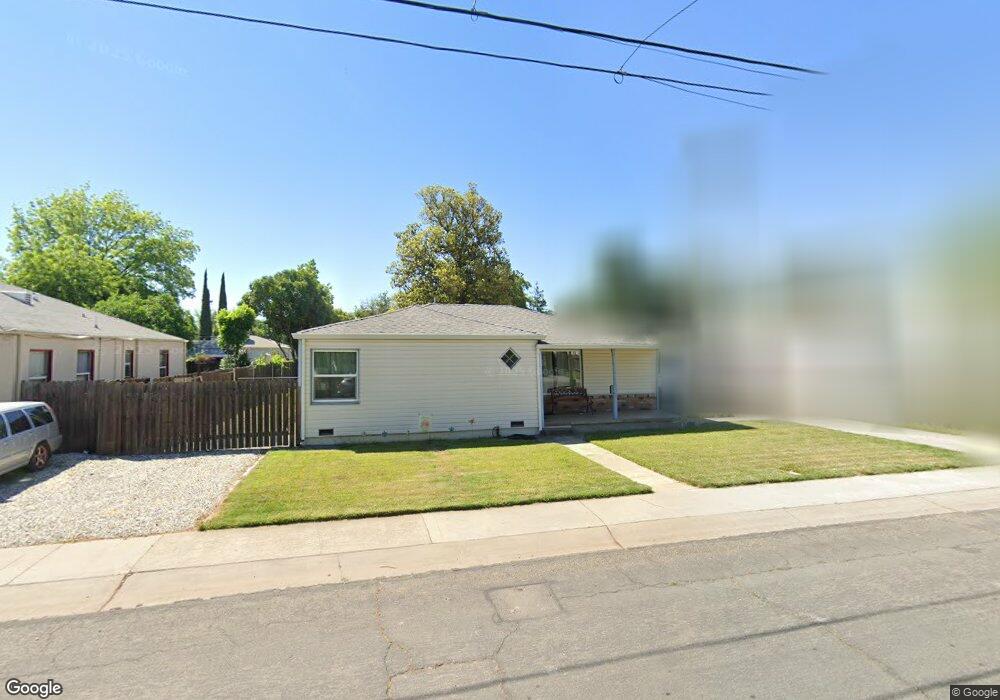
706 Jewell Ave Yuba City, CA 95991
Estimated Value: $218,000 - $338,000
4
Beds
1
Bath
1,429
Sq Ft
$202/Sq Ft
Est. Value
About This Home
This home is located at 706 Jewell Ave, Yuba City, CA 95991 and is currently estimated at $289,049, approximately $202 per square foot. 706 Jewell Ave is a home located in Sutter County with nearby schools including Park Avenue Elementary School, Gray Avenue Middle School, and Yuba City High School.
Ownership History
Date
Name
Owned For
Owner Type
Purchase Details
Closed on
Jun 8, 2004
Sold by
Clark Charles Spencer and Clark Cheryl Ann
Bought by
Clark Charles Spencer and Clark Cheryl
Current Estimated Value
Home Financials for this Owner
Home Financials are based on the most recent Mortgage that was taken out on this home.
Original Mortgage
$70,000
Interest Rate
5.99%
Mortgage Type
New Conventional
Create a Home Valuation Report for This Property
The Home Valuation Report is an in-depth analysis detailing your home's value as well as a comparison with similar homes in the area
Home Values in the Area
Average Home Value in this Area
Purchase History
| Date | Buyer | Sale Price | Title Company |
|---|---|---|---|
| Clark Charles Spencer | -- | Placer Title Company |
Source: Public Records
Mortgage History
| Date | Status | Borrower | Loan Amount |
|---|---|---|---|
| Closed | Clark Charles Spencer | $70,000 |
Source: Public Records
Tax History Compared to Growth
Tax History
| Year | Tax Paid | Tax Assessment Tax Assessment Total Assessment is a certain percentage of the fair market value that is determined by local assessors to be the total taxable value of land and additions on the property. | Land | Improvement |
|---|---|---|---|---|
| 2025 | $1,464 | $130,474 | $30,604 | $99,870 |
| 2024 | $1,464 | $127,916 | $30,004 | $97,912 |
| 2023 | $1,464 | $125,409 | $29,416 | $95,993 |
| 2022 | $1,395 | $122,951 | $28,840 | $94,111 |
| 2021 | $1,379 | $120,578 | $28,294 | $92,284 |
| 2020 | $1,355 | $119,342 | $28,004 | $91,338 |
| 2019 | $1,326 | $117,003 | $27,455 | $89,548 |
| 2018 | $1,306 | $114,708 | $26,917 | $87,791 |
| 2017 | $1,273 | $112,458 | $26,389 | $86,069 |
| 2016 | $1,247 | $110,254 | $25,872 | $84,382 |
| 2015 | $1,227 | $108,597 | $25,483 | $83,114 |
| 2014 | $1,212 | $106,470 | $24,984 | $81,486 |
Source: Public Records
Map
Nearby Homes