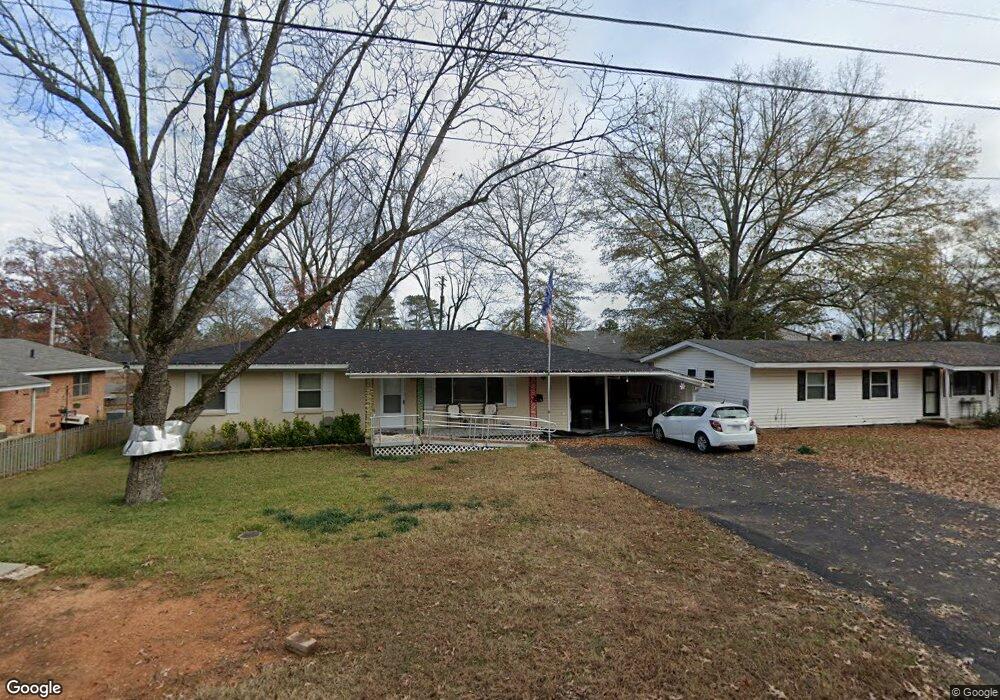
706 N Oak St Sheridan, AR 72150
Estimated Value: $154,458 - $188,000
3
Beds
2
Baths
1,500
Sq Ft
$115/Sq Ft
Est. Value
About This Home
This home is located at 706 N Oak St, Sheridan, AR 72150 and is currently estimated at $172,615, approximately $115 per square foot. 706 N Oak St is a home located in Grant County with nearby schools including Sheridan High School.
Ownership History
Date
Name
Owned For
Owner Type
Purchase Details
Closed on
Dec 2, 2021
Sold by
Obrien Susan
Bought by
Obrien Garrett V
Current Estimated Value
Purchase Details
Closed on
Jul 20, 2012
Sold by
Castillo Alex K and Castillo Candice
Bought by
Obrien Garrett
Home Financials for this Owner
Home Financials are based on the most recent Mortgage that was taken out on this home.
Original Mortgage
$65,714
Outstanding Balance
$45,263
Interest Rate
3.7%
Mortgage Type
New Conventional
Estimated Equity
$127,352
Purchase Details
Closed on
Nov 5, 2002
Bought by
Edwards
Purchase Details
Closed on
Jun 1, 1994
Bought by
Hester
Create a Home Valuation Report for This Property
The Home Valuation Report is an in-depth analysis detailing your home's value as well as a comparison with similar homes in the area
Home Values in the Area
Average Home Value in this Area
Purchase History
| Date | Buyer | Sale Price | Title Company |
|---|---|---|---|
| Obrien Garrett V | -- | None Available | |
| Obrien Garrett | $84,000 | Stewart Title Company | |
| Edwards | $55,000 | -- | |
| For For P | -- | -- | |
| Hester | -- | -- |
Source: Public Records
Mortgage History
| Date | Status | Borrower | Loan Amount |
|---|---|---|---|
| Open | Obrien Garrett | $65,714 |
Source: Public Records
Tax History Compared to Growth
Tax History
| Year | Tax Paid | Tax Assessment Tax Assessment Total Assessment is a certain percentage of the fair market value that is determined by local assessors to be the total taxable value of land and additions on the property. | Land | Improvement |
|---|---|---|---|---|
| 2025 | $1,040 | $32,980 | $6,000 | $26,980 |
| 2024 | $945 | $21,630 | $3,300 | $18,330 |
| 2023 | $520 | $21,630 | $3,300 | $18,330 |
| 2022 | $530 | $21,630 | $3,300 | $18,330 |
| 2021 | $489 | $21,630 | $3,300 | $18,330 |
| 2020 | $448 | $18,280 | $2,100 | $16,180 |
| 2019 | $448 | $18,280 | $2,100 | $16,180 |
| 2018 | $473 | $18,280 | $2,100 | $16,180 |
| 2017 | $473 | $18,280 | $2,100 | $16,180 |
| 2015 | -- | $17,700 | $3,000 | $14,700 |
| 2014 | -- | $17,700 | $3,000 | $14,700 |
| 2012 | -- | $16,070 | $3,000 | $13,070 |
Source: Public Records
Map
Nearby Homes