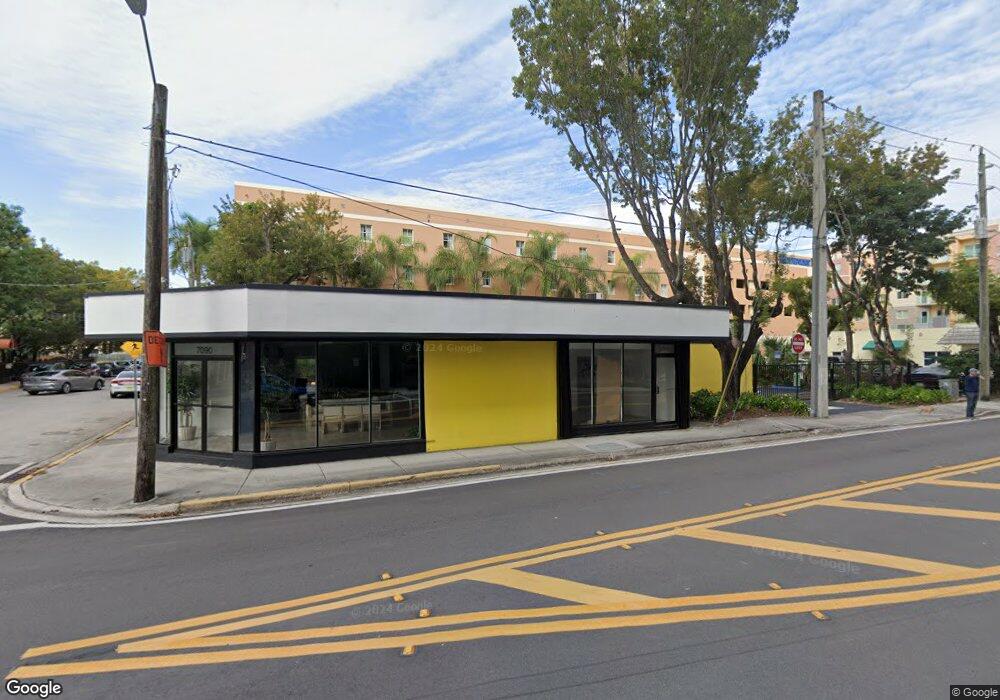
7090 SW 59th Place South Miami, FL 33143
Estimated Value: $963,889
--
Bed
--
Bath
30,000
Sq Ft
$32/Sq Ft
Est. Value
About This Home
Discover Somi Walk Residences, This exclusive South Miami address offers junior suites, 1 bedroom 1 bathroom, 1bedroom 1.5 bathrooms plus den, & 2-bedroom 2 bathroom residences. Enjoy resort-style amenities including an elegant lobby with 24hr concierge, heated pool, indoor pickleball courts, pet spa, a wellness center, business center with coworking stations, state of the art gym / yoga room, sauna, club room, bike storages and much more. Somi Walk residences combine luxury with modern living in a vibrant community, minutes to downtown South Miami, University of Miami, Coral Gables, Coconut Grove, Pinecrest and steps to the metrorail. Completion anticipated by end of 2026.
Ownership History
Date
Name
Owned For
Owner Type
Purchase Details
Closed on
Apr 23, 2021
Sold by
Spiegel Robert and Spiegel William
Bought by
Grec Pinecrest Llc
Current Estimated Value
Home Financials for this Owner
Home Financials are based on the most recent Mortgage that was taken out on this home.
Original Mortgage
$1,200,000
Outstanding Balance
$1,083,455
Interest Rate
3%
Mortgage Type
Purchase Money Mortgage
Create a Home Valuation Report for This Property
The Home Valuation Report is an in-depth analysis detailing your home's value as well as a comparison with similar homes in the area
Home Values in the Area
Average Home Value in this Area
Purchase History
| Date | Buyer | Sale Price | Title Company |
|---|---|---|---|
| Grec Pinecrest Llc | $3,100,000 | Attorney |
Source: Public Records
Mortgage History
| Date | Status | Borrower | Loan Amount |
|---|---|---|---|
| Open | Grec Pinecrest Llc | $1,200,000 |
Source: Public Records
Property History
| Date | Event | Price | List to Sale | Price per Sq Ft |
|---|---|---|---|---|
| 07/05/2025 07/05/25 | Off Market | $3,700 | -- | -- |
| 09/30/2024 09/30/24 | Price Changed | $3,700 | 0.0% | $6 / Sq Ft |
| 09/27/2024 09/27/24 | For Rent | $3,700 | -- | -- |
Tax History Compared to Growth
Tax History
| Year | Tax Paid | Tax Assessment Tax Assessment Total Assessment is a certain percentage of the fair market value that is determined by local assessors to be the total taxable value of land and additions on the property. | Land | Improvement |
|---|---|---|---|---|
| 2025 | $24,111 | $1,383,040 | $1,250,100 | $132,940 |
| 2024 | $26,502 | $1,258,717 | $1,125,000 | $133,717 |
| 2023 | $26,502 | $1,168,616 | $1,041,750 | $126,866 |
| 2022 | $26,570 | $1,377,696 | $1,250,100 | $127,596 |
| 2021 | $14,171 | $698,929 | $583,380 | $115,549 |
| 2020 | $14,243 | $700,704 | $583,380 | $117,324 |
| 2019 | $14,218 | $697,785 | $583,380 | $114,405 |
| 2018 | $13,947 | $699,634 | $583,380 | $116,254 |
| 2017 | $13,934 | $700,801 | $0 | $0 |
| 2016 | $14,136 | $697,587 | $0 | $0 |
| 2015 | $14,103 | $680,984 | $0 | $0 |
| 2014 | $13,592 | $619,077 | $0 | $0 |
Source: Public Records
Map
Nearby Homes
- 6001 SW 70th St Unit 429
- 6001 SW 70th St Unit 139
- 6001 SW 70th St Unit 542
- 6001 SW 70th St Unit 535
- 6001 SW 70th St Unit 127
- 6001 SW 70th St Unit 650
- 6001 SW 70th St Unit 133
- 6001 SW 70th St Unit 304
- 6001 SW 70th St Unit 231
- 6001 SW 70th St Unit 113
- 6001 SW 70th St Unit 130
- 5959 SW 69th St Unit 106
- 6007 SW 69th St Unit 74
- 6020 SW 68th St Unit 60
- 6103 SW 69th St Unit 41
- 6843 SW 62nd Ct
- 157th CT SW 65th Terrace
- 6001 SW 66th St
- 5834 SW 66th St
- 5839 SW 74th Terrace Unit 305
- 5959 SW 71st St
- 5959 SW 71st St Unit 808
- 5959 SW 71st St Unit 616
- 5959 SW 71st St Unit 922
- 5959 SW 71st St Unit 715
- 7000 SW 59th Place
- 137 Unincorporated Fl 33177-0000
- 0 Bird Rd
- Contractor Painting Confidential
- xxxx Xxxx
- 7025 SW 59th Place
- 6001 SW 70 St SW 70st Unit 235
- 6001 70 St # 336 Unit 336
- 5995 SW 71st St
- 6001 SW 70 St Unit 208
- 6001 SW 70 St Unit 511
- 6001 SW 70th St Unit 425
- 6001 SW 70th St Unit 317
- 6001 SW 70th St Unit 515