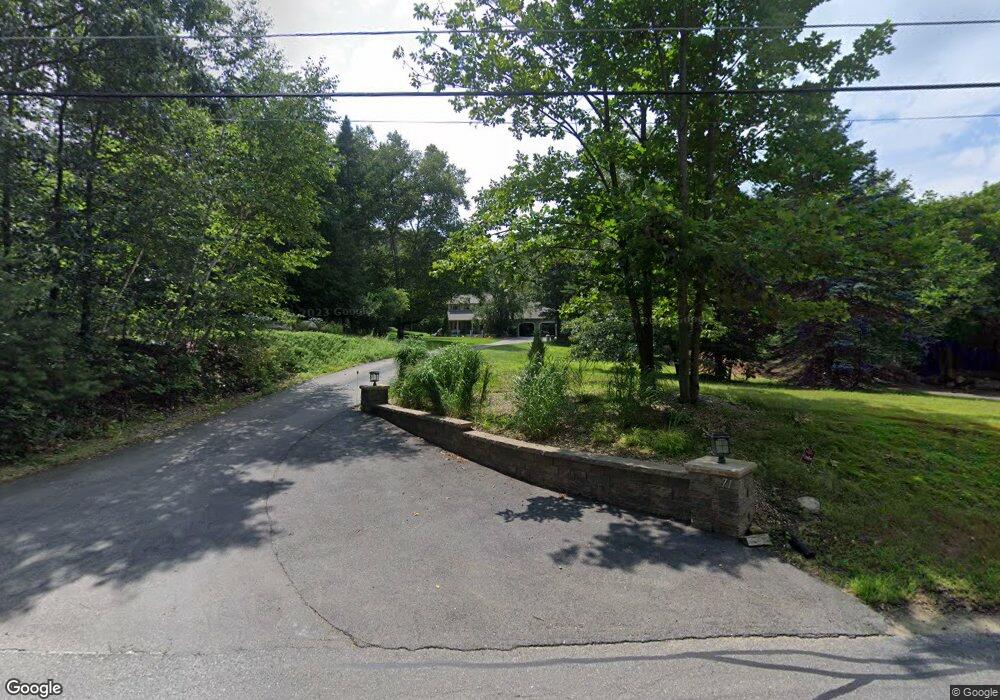
71 Crawford St Northborough, MA 01532
Estimated Value: $854,199 - $869,000
3
Beds
3
Baths
2,231
Sq Ft
$386/Sq Ft
Est. Value
About This Home
This home is located at 71 Crawford St, Northborough, MA 01532 and is currently estimated at $861,050, approximately $385 per square foot. 71 Crawford St is a home located in Worcester County with nearby schools including Lincoln Street Elementary School, Robert E. Melican Middle School, and Algonquin Regional High School.
Ownership History
Date
Name
Owned For
Owner Type
Purchase Details
Closed on
May 1, 2020
Sold by
Dubin Shelley M and Lindenberg Dubin
Bought by
Dubin Lindenberg Ft
Current Estimated Value
Purchase Details
Closed on
Apr 2, 1991
Sold by
Poore Medford F and Poore Robin H
Bought by
Lindenberg Dennis and Dubin Shelley M
Home Financials for this Owner
Home Financials are based on the most recent Mortgage that was taken out on this home.
Original Mortgage
$150,000
Interest Rate
9.17%
Mortgage Type
Purchase Money Mortgage
Create a Home Valuation Report for This Property
The Home Valuation Report is an in-depth analysis detailing your home's value as well as a comparison with similar homes in the area
Home Values in the Area
Average Home Value in this Area
Purchase History
| Date | Buyer | Sale Price | Title Company |
|---|---|---|---|
| Dubin Lindenberg Ft | -- | None Available | |
| Lindenberg Dennis | $216,500 | -- |
Source: Public Records
Mortgage History
| Date | Status | Borrower | Loan Amount |
|---|---|---|---|
| Previous Owner | Lindenberg Dennis | $150,000 | |
| Previous Owner | Lindenberg Dennis | $100,000 | |
| Previous Owner | Lindenberg Dennis | $150,000 |
Source: Public Records
Tax History Compared to Growth
Tax History
| Year | Tax Paid | Tax Assessment Tax Assessment Total Assessment is a certain percentage of the fair market value that is determined by local assessors to be the total taxable value of land and additions on the property. | Land | Improvement |
|---|---|---|---|---|
| 2025 | $11,161 | $783,200 | $334,800 | $448,400 |
| 2024 | $9,256 | $648,200 | $217,100 | $431,100 |
| 2023 | $8,884 | $600,700 | $205,500 | $395,200 |
| 2022 | $8,552 | $518,600 | $196,300 | $322,300 |
| 2021 | $8,283 | $483,800 | $179,500 | $304,300 |
| 2020 | $8,289 | $480,500 | $179,500 | $301,000 |
| 2019 | $8,158 | $475,700 | $179,500 | $296,200 |
| 2018 | $7,904 | $454,500 | $172,900 | $281,600 |
| 2017 | $7,831 | $450,300 | $172,900 | $277,400 |
| 2016 | $7,670 | $446,700 | $169,300 | $277,400 |
| 2015 | $7,562 | $452,000 | $180,200 | $271,800 |
| 2014 | $7,258 | $437,500 | $180,200 | $257,300 |
Source: Public Records
Map
Nearby Homes
- 329 Crawford St
- 105 Lincoln St
- 209 North St
- 81 West St
- 243 Spring St
- 26 High St
- 139 Davis St
- 40 High St
- 7 Northland Rd
- 9 Morningside Dr
- 19 Crestwood Dr Unit 19
- 132 W Main St
- 25 Castle Rd
- 10 Karen Ave
- 39 Pleasant St Unit B19
- 39 Pleasant St Unit C5
- 89 W Main St
- 90 W Main St
- 20 Olde Colony Dr
- 198 South St