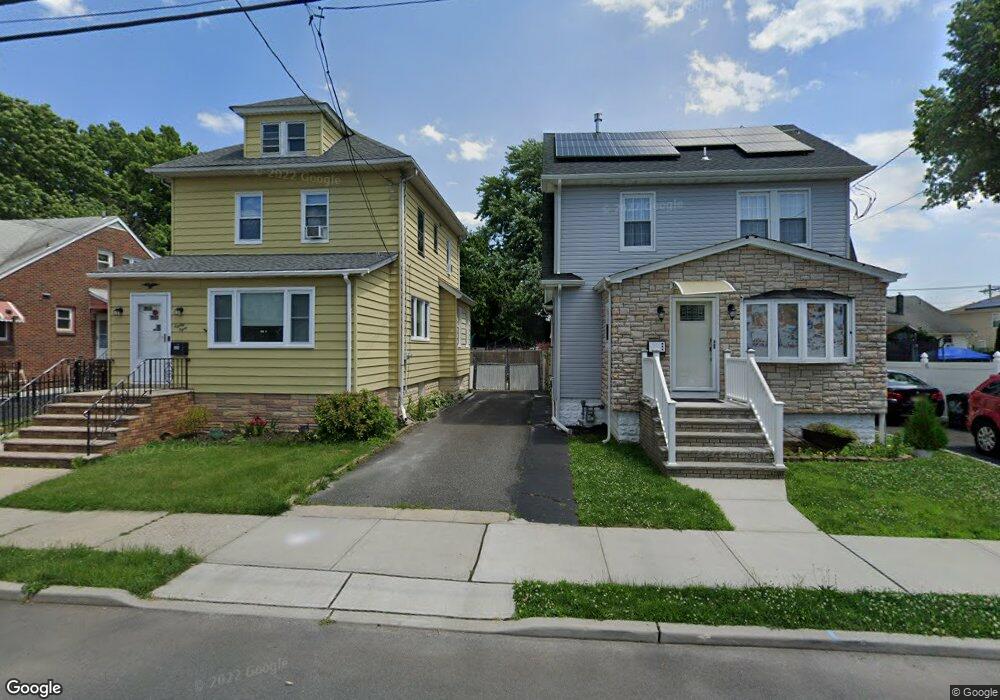
71 Jackson Cir Carteret, NJ 07008
Estimated Value: $569,902 - $604,000
3
Beds
2
Baths
1,648
Sq Ft
$359/Sq Ft
Est. Value
About This Home
This home is located at 71 Jackson Cir, Carteret, NJ 07008 and is currently estimated at $590,976, approximately $358 per square foot. 71 Jackson Cir is a home located in Middlesex County with nearby schools including Carteret High School and St Joseph School.
Ownership History
Date
Name
Owned For
Owner Type
Purchase Details
Closed on
Mar 3, 2021
Sold by
Lynx Asset Services Llc
Bought by
Paniagua Jeffrey
Current Estimated Value
Home Financials for this Owner
Home Financials are based on the most recent Mortgage that was taken out on this home.
Original Mortgage
$407,483
Interest Rate
3%
Mortgage Type
FHA
Purchase Details
Closed on
Feb 5, 2020
Sold by
Tidaback Charles M and Tidaback Stephanie
Bought by
Lynx Asset Services Llc
Purchase Details
Closed on
Jan 26, 2007
Purchase Details
Closed on
May 6, 1996
Sold by
Denton William
Bought by
Tidaback Charles and Hack Stephanie
Home Financials for this Owner
Home Financials are based on the most recent Mortgage that was taken out on this home.
Original Mortgage
$112,000
Interest Rate
7.67%
Create a Home Valuation Report for This Property
The Home Valuation Report is an in-depth analysis detailing your home's value as well as a comparison with similar homes in the area
Home Values in the Area
Average Home Value in this Area
Purchase History
| Date | Buyer | Sale Price | Title Company |
|---|---|---|---|
| Paniagua Jeffrey | $415,000 | Nu World Title Llc | |
| Lynx Asset Services Llc | -- | Afrm Title & Abstract | |
| -- | -- | -- | |
| Tidaback Charles | $118,000 | -- |
Source: Public Records
Mortgage History
| Date | Status | Borrower | Loan Amount |
|---|---|---|---|
| Previous Owner | Paniagua Jeffrey | $407,483 | |
| Previous Owner | Tidaback Charles | $112,000 |
Source: Public Records
Tax History Compared to Growth
Tax History
| Year | Tax Paid | Tax Assessment Tax Assessment Total Assessment is a certain percentage of the fair market value that is determined by local assessors to be the total taxable value of land and additions on the property. | Land | Improvement |
|---|---|---|---|---|
| 2025 | $7,597 | $494,400 | $358,200 | $136,200 |
| 2024 | $7,402 | $238,300 | $130,600 | $107,700 |
| 2023 | $7,402 | $238,300 | $130,600 | $107,700 |
| 2022 | $7,197 | $238,300 | $130,600 | $107,700 |
| 2021 | $6,854 | $238,300 | $130,600 | $107,700 |
| 2020 | $6,854 | $238,300 | $130,600 | $107,700 |
| 2019 | $6,656 | $238,300 | $130,600 | $107,700 |
| 2018 | $6,498 | $238,300 | $130,600 | $107,700 |
| 2017 | $6,267 | $238,300 | $130,600 | $107,700 |
| 2016 | $6,302 | $199,000 | $95,600 | $103,400 |
| 2015 | $6,211 | $199,000 | $95,600 | $103,400 |
| 2014 | $5,940 | $199,000 | $95,600 | $103,400 |
Source: Public Records
Map
Nearby Homes