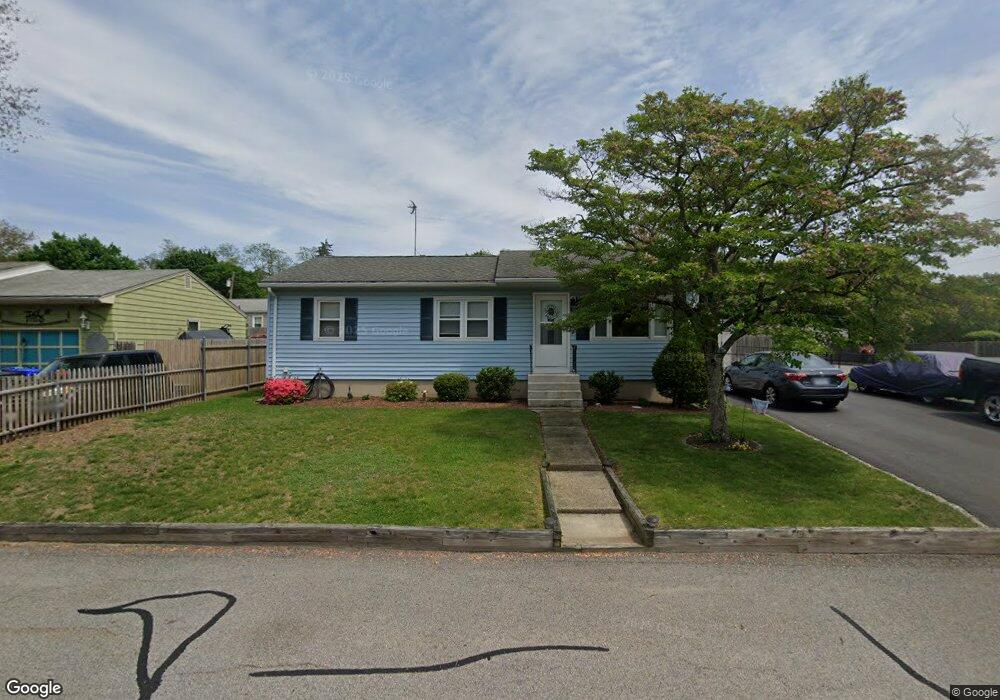
71 Lowell St West Warwick, RI 02893
Lippitt-Harris NeighborhoodEstimated Value: $369,443 - $416,000
3
Beds
2
Baths
1,288
Sq Ft
$303/Sq Ft
Est. Value
About This Home
This home is located at 71 Lowell St, West Warwick, RI 02893 and is currently estimated at $390,611, approximately $303 per square foot. 71 Lowell St is a home located in Kent County with nearby schools including West Warwick High School, St Joseph School, and Islamic School of Rhode Island.
Ownership History
Date
Name
Owned For
Owner Type
Purchase Details
Closed on
Dec 1, 2011
Sold by
Fnma
Bought by
Bonn Frederick W
Current Estimated Value
Purchase Details
Closed on
Aug 17, 2011
Sold by
Cenlar Fsb
Bought by
Federal National Mortgage Association
Purchase Details
Closed on
May 22, 1998
Sold by
Rice Richard P and Rice Dorothy
Bought by
Shaughnessy John J and Shaughnessy Melanie
Home Financials for this Owner
Home Financials are based on the most recent Mortgage that was taken out on this home.
Original Mortgage
$91,494
Interest Rate
7.03%
Create a Home Valuation Report for This Property
The Home Valuation Report is an in-depth analysis detailing your home's value as well as a comparison with similar homes in the area
Home Values in the Area
Average Home Value in this Area
Purchase History
| Date | Buyer | Sale Price | Title Company |
|---|---|---|---|
| Bonn Frederick W | $80,000 | -- | |
| Federal National Mortgage Association | $131,184 | -- | |
| Shaughnessy John J | $90,000 | -- |
Source: Public Records
Mortgage History
| Date | Status | Borrower | Loan Amount |
|---|---|---|---|
| Previous Owner | Shaughnessy John J | $133,700 | |
| Previous Owner | Shaughnessy John J | $123,000 | |
| Previous Owner | Shaughnessy John J | $91,494 |
Source: Public Records
Tax History Compared to Growth
Tax History
| Year | Tax Paid | Tax Assessment Tax Assessment Total Assessment is a certain percentage of the fair market value that is determined by local assessors to be the total taxable value of land and additions on the property. | Land | Improvement |
|---|---|---|---|---|
| 2025 | $3,965 | $277,500 | $85,600 | $191,900 |
| 2024 | $4,656 | $249,100 | $70,000 | $179,100 |
| 2023 | $4,564 | $249,100 | $70,000 | $179,100 |
| 2022 | $4,494 | $249,100 | $70,000 | $179,100 |
| 2021 | $4,296 | $186,800 | $58,800 | $128,000 |
| 2020 | $4,296 | $186,800 | $58,800 | $128,000 |
| 2019 | $5,477 | $186,800 | $58,800 | $128,000 |
| 2018 | $3,979 | $146,400 | $56,300 | $90,100 |
| 2017 | $3,852 | $146,400 | $56,300 | $90,100 |
| 2016 | $3,783 | $146,400 | $56,300 | $90,100 |
| 2015 | $3,590 | $138,300 | $56,300 | $82,000 |
| 2014 | $3,511 | $138,300 | $56,300 | $82,000 |
Source: Public Records
Map
Nearby Homes