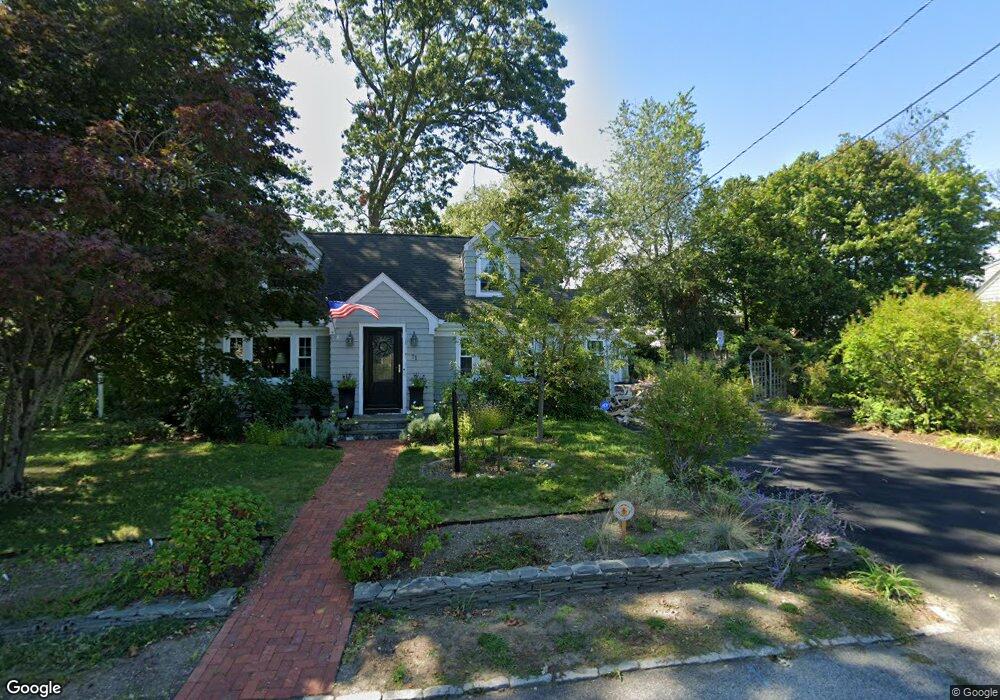
71 Park View Ave Warwick, RI 02888
Lakewood NeighborhoodEstimated Value: $421,110 - $453,000
3
Beds
2
Baths
1,897
Sq Ft
$231/Sq Ft
Est. Value
About This Home
This home is located at 71 Park View Ave, Warwick, RI 02888 and is currently estimated at $437,528, approximately $230 per square foot. 71 Park View Ave is a home located in Kent County with nearby schools including St. Peter School and Saint Paul School.
Ownership History
Date
Name
Owned For
Owner Type
Purchase Details
Closed on
Aug 30, 2004
Sold by
Lucas Paul A and Lucas Kelly A
Bought by
Feiner Lynn S
Current Estimated Value
Purchase Details
Closed on
Apr 30, 1993
Sold by
Carey Daniel A and Carey Rosemarie
Bought by
Lucas Paul A
Purchase Details
Closed on
Sep 28, 1990
Sold by
Jennings Claudia R
Bought by
Carey Daniel A
Create a Home Valuation Report for This Property
The Home Valuation Report is an in-depth analysis detailing your home's value as well as a comparison with similar homes in the area
Home Values in the Area
Average Home Value in this Area
Purchase History
| Date | Buyer | Sale Price | Title Company |
|---|---|---|---|
| Feiner Lynn S | $270,000 | -- | |
| Lucas Paul A | $105,000 | -- | |
| Lucas Paul A | $105,000 | -- | |
| Carey Daniel A | $117,000 | -- | |
| Carey Daniel A | $117,000 | -- |
Source: Public Records
Mortgage History
| Date | Status | Borrower | Loan Amount |
|---|---|---|---|
| Open | Carey Daniel A | $204,800 | |
| Closed | Carey Daniel A | $228,000 |
Source: Public Records
Tax History Compared to Growth
Tax History
| Year | Tax Paid | Tax Assessment Tax Assessment Total Assessment is a certain percentage of the fair market value that is determined by local assessors to be the total taxable value of land and additions on the property. | Land | Improvement |
|---|---|---|---|---|
| 2025 | $4,580 | $360,600 | $105,400 | $255,200 |
| 2024 | $4,600 | $317,900 | $91,600 | $226,300 |
| 2023 | $4,511 | $317,900 | $91,600 | $226,300 |
| 2022 | $4,214 | $225,000 | $61,400 | $163,600 |
| 2021 | $4,214 | $225,000 | $61,400 | $163,600 |
| 2020 | $4,214 | $225,000 | $61,400 | $163,600 |
| 2019 | $4,214 | $225,000 | $61,400 | $163,600 |
| 2018 | $3,900 | $187,500 | $61,400 | $126,100 |
| 2017 | $3,795 | $187,500 | $61,400 | $126,100 |
| 2016 | $3,795 | $187,500 | $61,400 | $126,100 |
| 2015 | $3,505 | $168,900 | $61,200 | $107,700 |
| 2014 | $3,388 | $168,900 | $61,200 | $107,700 |
| 2013 | $3,343 | $168,900 | $61,200 | $107,700 |
Source: Public Records
Map
Nearby Homes