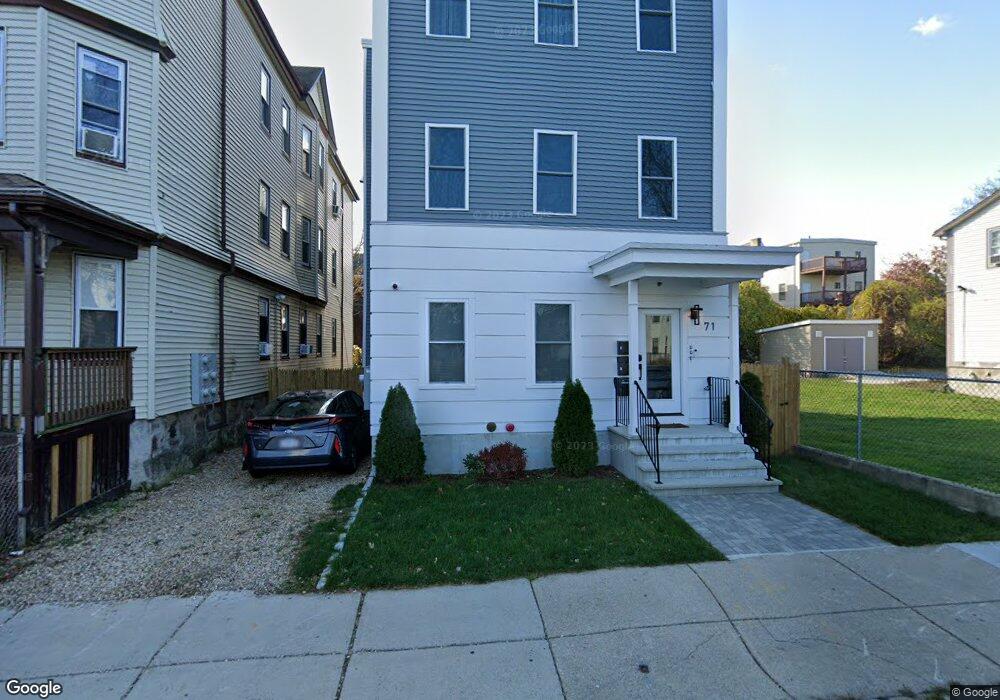
71 Savin St Roxbury, MA 02119
Sav-Mor NeighborhoodEstimated Value: $639,826
9
Beds
6
Baths
3,250
Sq Ft
$197/Sq Ft
Est. Value
About This Home
This home is located at 71 Savin St, Roxbury, MA 02119 and is currently estimated at $639,826, approximately $196 per square foot. 71 Savin St is a home located in Suffolk County with nearby schools including Bridge Boston Charter School.
Ownership History
Date
Name
Owned For
Owner Type
Purchase Details
Closed on
Mar 22, 2021
Sold by
Edge Re Investments Llc
Bought by
Sherer Mark
Current Estimated Value
Home Financials for this Owner
Home Financials are based on the most recent Mortgage that was taken out on this home.
Original Mortgage
$446,500
Outstanding Balance
$400,256
Interest Rate
2.7%
Mortgage Type
Purchase Money Mortgage
Estimated Equity
$239,570
Purchase Details
Closed on
Feb 19, 2021
Sold by
Edge Re Investments Llc
Bought by
Degani Chiara
Home Financials for this Owner
Home Financials are based on the most recent Mortgage that was taken out on this home.
Original Mortgage
$446,500
Outstanding Balance
$400,256
Interest Rate
2.7%
Mortgage Type
Purchase Money Mortgage
Estimated Equity
$239,570
Purchase Details
Closed on
Jan 8, 1993
Sold by
Warren St Rt 386
Bought by
Guilford George
Create a Home Valuation Report for This Property
The Home Valuation Report is an in-depth analysis detailing your home's value as well as a comparison with similar homes in the area
Home Values in the Area
Average Home Value in this Area
Purchase History
| Date | Buyer | Sale Price | Title Company |
|---|---|---|---|
| Sherer Mark | $470,000 | None Available | |
| Degani Chiara | $497,000 | None Available | |
| Guilford George | $100,000 | -- |
Source: Public Records
Mortgage History
| Date | Status | Borrower | Loan Amount |
|---|---|---|---|
| Open | Sherer Mark | $446,500 | |
| Closed | Degani Chiara | $472,150 |
Source: Public Records
Tax History Compared to Growth
Tax History
| Year | Tax Paid | Tax Assessment Tax Assessment Total Assessment is a certain percentage of the fair market value that is determined by local assessors to be the total taxable value of land and additions on the property. | Land | Improvement |
|---|---|---|---|---|
| 2025 | $0 | $0 | $0 | $0 |
| 2024 | $0 | $0 | $0 | $0 |
| 2023 | $0 | $0 | $0 | $0 |
| 2022 | $9,103 | $836,700 | $176,200 | $660,500 |
| 2021 | $7,282 | $682,500 | $151,000 | $531,500 |
| 2020 | $2,507 | $237,400 | $169,300 | $68,100 |
| 2019 | $2,234 | $212,000 | $121,700 | $90,300 |
| 2018 | $2,057 | $196,300 | $121,700 | $74,600 |
| 2017 | $2,079 | $196,300 | $121,700 | $74,600 |
| 2016 | $1,878 | $170,700 | $121,700 | $49,000 |
| 2015 | $2,399 | $198,100 | $89,400 | $108,700 |
| 2014 | $2,329 | $185,100 | $89,400 | $95,700 |
Source: Public Records
Map
Nearby Homes
- 5 Glenburne St
- 31 Dewey St
- 472 Warren St
- 476 Warren St
- 2 Otisfield St
- 194 Blue Hill Ave
- 36-38 Elm Hill Park
- 8 Adrian St
- 495 Warren St
- 175 Howard Ave Unit 2
- 4 Wyoming St Unit 2
- 28 Woodbine St
- 62 Clifford St Unit A
- 12 Danube St
- 7 Waumbeck St Unit 3
- 163 Howard Ave
- 96-98 Woodledge St
- 91 Howard Ave
- 45 Brookford St
- 52 Intervale St
- 71 Savin St
- 71 Savin St Unit 3
- 71 Savin St Unit 2
- 71 Savin St Unit 1
- 75 Savin St
- 63 Savin St
- 77 Savin St
- 77 Savin St Unit 3
- 77 Savin St Unit 1
- 77 Savin St Unit 2
- 50 Quincy St
- 50 Quincy St Unit 2
- 50 Quincy St Unit 1
- 50 Quincy Ct Unit 2
- 77 - 79 Savin St
- 52 Quincy St Unit 3
- 52 Quincy St Unit 2
- 52 Quincy St Unit 1
- 68 Savin St
- 68 Savin St Unit 68