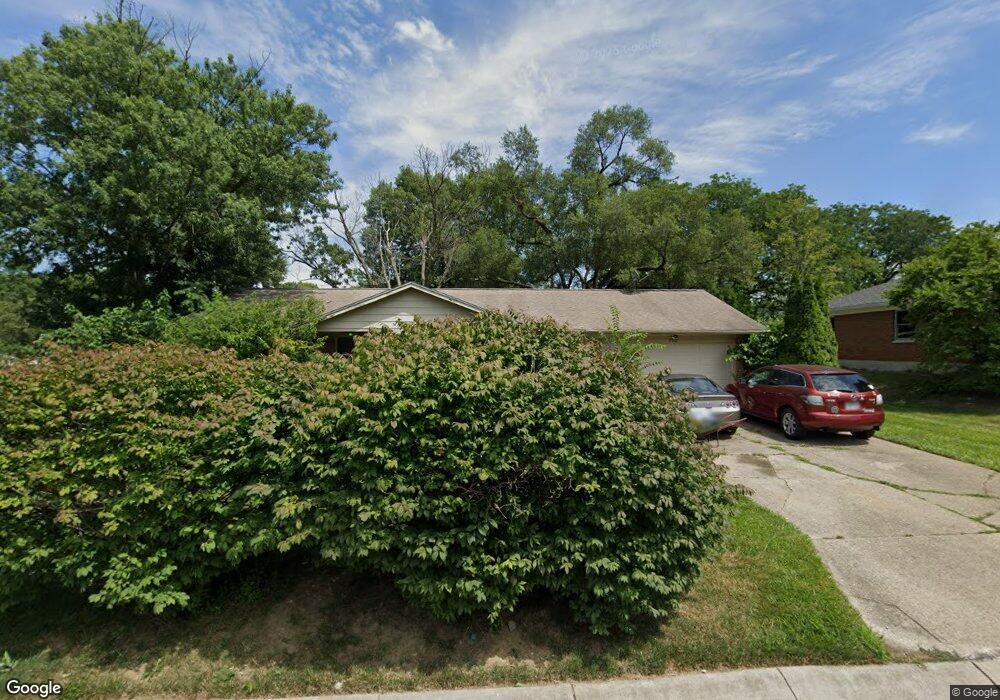
710 Clareridge Ln Dayton, OH 45458
Estimated Value: $301,000 - $325,000
3
Beds
2
Baths
1,891
Sq Ft
$165/Sq Ft
Est. Value
About This Home
This home is located at 710 Clareridge Ln, Dayton, OH 45458 and is currently estimated at $312,814, approximately $165 per square foot. 710 Clareridge Ln is a home located in Montgomery County with nearby schools including Primary Village South, Cline Elementary, and Tower Heights Middle School.
Ownership History
Date
Name
Owned For
Owner Type
Purchase Details
Closed on
Sep 29, 2005
Sold by
Dove Richard A and Dove Anita J
Bought by
Dove Jason A
Current Estimated Value
Home Financials for this Owner
Home Financials are based on the most recent Mortgage that was taken out on this home.
Original Mortgage
$109,600
Outstanding Balance
$58,922
Interest Rate
5.83%
Mortgage Type
Purchase Money Mortgage
Estimated Equity
$253,892
Purchase Details
Closed on
Apr 19, 2004
Sold by
Tuffey Patrick A and Tuffey Patricia R
Bought by
Dove Richard A and Dove Anita J
Home Financials for this Owner
Home Financials are based on the most recent Mortgage that was taken out on this home.
Original Mortgage
$108,000
Interest Rate
5.12%
Mortgage Type
Purchase Money Mortgage
Purchase Details
Closed on
Apr 17, 1997
Sold by
Grosse Ralph H and Grosse Dorothy J
Bought by
Neal Corey M and Neal Jill K
Purchase Details
Closed on
Nov 12, 1993
Sold by
Hudepohl Stephen E and Hudepohl Dannette
Bought by
Grosse Ralph H and Grosse Dorothy J
Create a Home Valuation Report for This Property
The Home Valuation Report is an in-depth analysis detailing your home's value as well as a comparison with similar homes in the area
Home Values in the Area
Average Home Value in this Area
Purchase History
| Date | Buyer | Sale Price | Title Company |
|---|---|---|---|
| Dove Jason A | $137,000 | Midwest Title Company | |
| Dove Richard A | $135,000 | -- | |
| Neal Corey M | $103,500 | -- | |
| Grosse Ralph H | -- | -- |
Source: Public Records
Mortgage History
| Date | Status | Borrower | Loan Amount |
|---|---|---|---|
| Open | Dove Jason A | $109,600 | |
| Previous Owner | Dove Richard A | $108,000 |
Source: Public Records
Tax History Compared to Growth
Tax History
| Year | Tax Paid | Tax Assessment Tax Assessment Total Assessment is a certain percentage of the fair market value that is determined by local assessors to be the total taxable value of land and additions on the property. | Land | Improvement |
|---|---|---|---|---|
| 2024 | $4,860 | $83,660 | $14,390 | $69,270 |
| 2023 | $4,860 | $83,660 | $14,390 | $69,270 |
| 2022 | $4,477 | $61,100 | $10,500 | $50,600 |
| 2021 | $4,489 | $61,100 | $10,500 | $50,600 |
| 2020 | $4,483 | $61,100 | $10,500 | $50,600 |
| 2019 | $4,279 | $52,050 | $10,500 | $41,550 |
| 2018 | $3,794 | $52,050 | $10,500 | $41,550 |
| 2017 | $3,750 | $52,050 | $10,500 | $41,550 |
| 2016 | $3,755 | $49,190 | $10,500 | $38,690 |
| 2015 | $3,716 | $49,190 | $10,500 | $38,690 |
| 2014 | $3,716 | $49,190 | $10,500 | $38,690 |
| 2012 | -- | $46,460 | $10,500 | $35,960 |
Source: Public Records
Map
Nearby Homes
- 694 Spring Ridge Place
- 843 Clareridge Ln Unit 843
- 35 Bywood Ct
- 1071 Star Valley Ct
- 9095 Heather Dr
- 1052 Quiet Brook Trail
- 1016 Quiet Brook Trail
- 325 Annette Dr
- 170 S Main St Unit C
- 210 Anton Ct
- 9183 Mary Haynes Dr
- 9517 Moorgate Ct
- 284 Tauber Dr
- 255 Gershwin Dr
- 9375 Shawhan Dr
- 479 Beth Page Cir Unit 74797
- 9618 Whalers Wharf Unit 833
- 9139 Indian Springs Ct
- 51 Winchester (#E) Place
- 8823 Birkdale Hills Cir Unit 108823
- 706 Clareridge Ln
- 718 Clareridge Ln
- 710 Spring Ridge Place
- 730 Clareridge Ln
- 743 Clareridge Ln Unit 743
- 745 Clareridge Ln Unit 745
- 741 Clareridge Ln Unit 741
- 749 Clareridge Ln Unit 749
- 739 Clareridge Ln Unit 739
- 714 Spring Ridge Place
- 747 Clareridge Ln Unit 747
- 711 Clareridge Ln Unit 711
- 751 Clareridge Ln Unit 751
- 731 Clareridge Ln Unit 731
- 733 Clareridge Ln Unit 733
- 801 Clareridge Ln Unit 801
- 753 Clareridge Ln Unit 753
- 799 Clareridge Ln Unit 799
- 734 Clareridge Ln
- 705 Clareridge Ln Unit 705