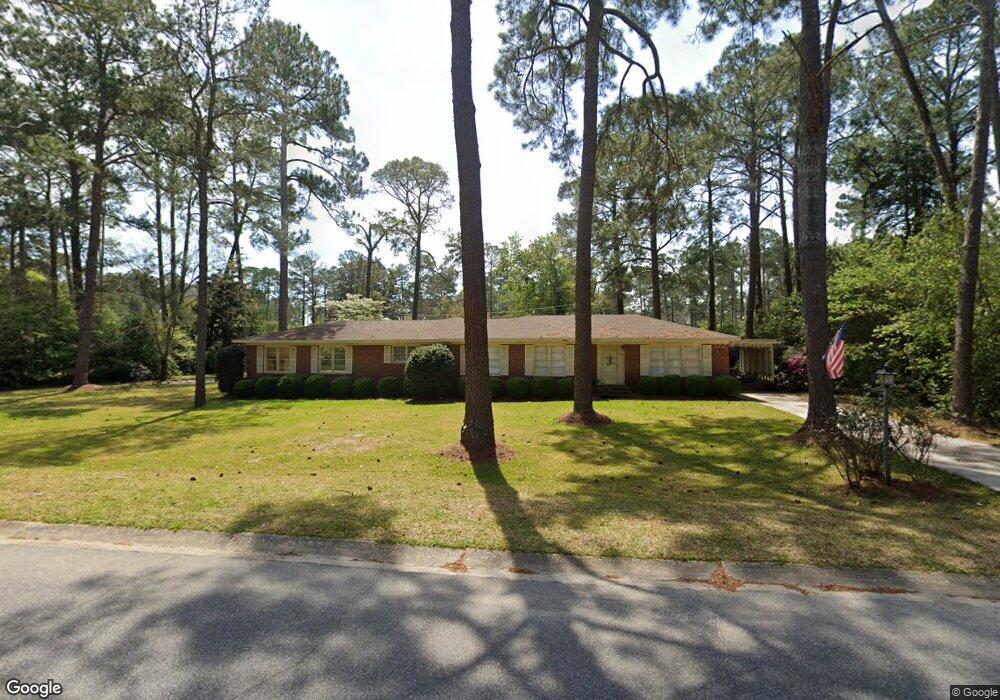
710 E 21st Ave Cordele, GA 31015
Estimated Value: $156,000 - $209,000
4
Beds
3
Baths
1,828
Sq Ft
$98/Sq Ft
Est. Value
About This Home
This home is located at 710 E 21st Ave, Cordele, GA 31015 and is currently estimated at $179,059, approximately $97 per square foot. 710 E 21st Ave is a home located in Crisp County with nearby schools including Crisp County Elementary School, Crisp County Primary School, and Crisp County Middle School.
Ownership History
Date
Name
Owned For
Owner Type
Purchase Details
Closed on
Sep 12, 2012
Sold by
Holloway Kevin Morris
Bought by
Hughes Katherine E
Current Estimated Value
Home Financials for this Owner
Home Financials are based on the most recent Mortgage that was taken out on this home.
Original Mortgage
$68,600
Outstanding Balance
$47,376
Interest Rate
3.68%
Mortgage Type
New Conventional
Estimated Equity
$131,683
Purchase Details
Closed on
Jan 1, 2012
Sold by
Holloway Kevin Morris
Bought by
Holloway Kevin Morris
Purchase Details
Closed on
Oct 15, 2010
Sold by
Chancey Warren T
Bought by
Holloway Kevin Morris
Home Financials for this Owner
Home Financials are based on the most recent Mortgage that was taken out on this home.
Original Mortgage
$59,347
Interest Rate
4.37%
Mortgage Type
Purchase Money Mortgage
Purchase Details
Closed on
Nov 7, 2008
Sold by
Chancey Eila Jo
Bought by
Chancey Eila Jo and Chancey Warren T
Purchase Details
Closed on
Jan 1, 1984
Bought by
Chancey Eila Jo
Create a Home Valuation Report for This Property
The Home Valuation Report is an in-depth analysis detailing your home's value as well as a comparison with similar homes in the area
Home Values in the Area
Average Home Value in this Area
Purchase History
| Date | Buyer | Sale Price | Title Company |
|---|---|---|---|
| Hughes Katherine E | $85,750 | -- | |
| Holloway Kevin Morris | $99,000 | -- | |
| Holloway Kevin Morris | $75,000 | -- | |
| Chancey Eila Jo | -- | -- | |
| Chancey Eila Jo | -- | -- |
Source: Public Records
Mortgage History
| Date | Status | Borrower | Loan Amount |
|---|---|---|---|
| Open | Hughes Katherine E | $68,600 | |
| Previous Owner | Holloway Kevin Morris | $59,347 |
Source: Public Records
Tax History Compared to Growth
Tax History
| Year | Tax Paid | Tax Assessment Tax Assessment Total Assessment is a certain percentage of the fair market value that is determined by local assessors to be the total taxable value of land and additions on the property. | Land | Improvement |
|---|---|---|---|---|
| 2025 | $1,855 | $57,975 | $6,554 | $51,421 |
| 2024 | $1,855 | $53,135 | $6,554 | $46,581 |
| 2023 | $1,726 | $47,438 | $3,277 | $44,161 |
| 2022 | $1,137 | $45,017 | $3,277 | $41,740 |
| 2021 | $1,114 | $42,597 | $3,277 | $39,320 |
| 2020 | $1,143 | $42,597 | $3,277 | $39,320 |
| 2019 | $1,151 | $42,597 | $3,277 | $39,320 |
| 2018 | $1,087 | $38,864 | $6,226 | $32,638 |
| 2017 | $1,578 | $38,864 | $6,226 | $32,638 |
| 2016 | $1,090 | $38,864 | $6,226 | $32,638 |
| 2015 | -- | $38,864 | $6,226 | $32,638 |
| 2014 | -- | $38,864 | $6,226 | $32,638 |
| 2013 | -- | $38,864 | $6,226 | $32,638 |
Source: Public Records
Map
Nearby Homes
- 706 E 21st Ave
- 716 E 21st Ave
- 709 E 22nd Ave
- 705 E 22nd Ave
- 711 E 21st Ave
- 717 E 22nd Ave
- 722 E 21st Ave
- 702 E 21st Ave
- 717 E 21st Ave
- 701 E 22nd Ave
- 719 E 22nd Ave
- 701 E 21st Ave
- 721 E 21st Ave
- 716 E 20th Ave
- 714 E 22nd Ave
- 1101 S Hickory St
- 1101 S Hickory St
- 1101 S Hickory St
- 704 E 22nd Ave
- 718 E 22nd Ave