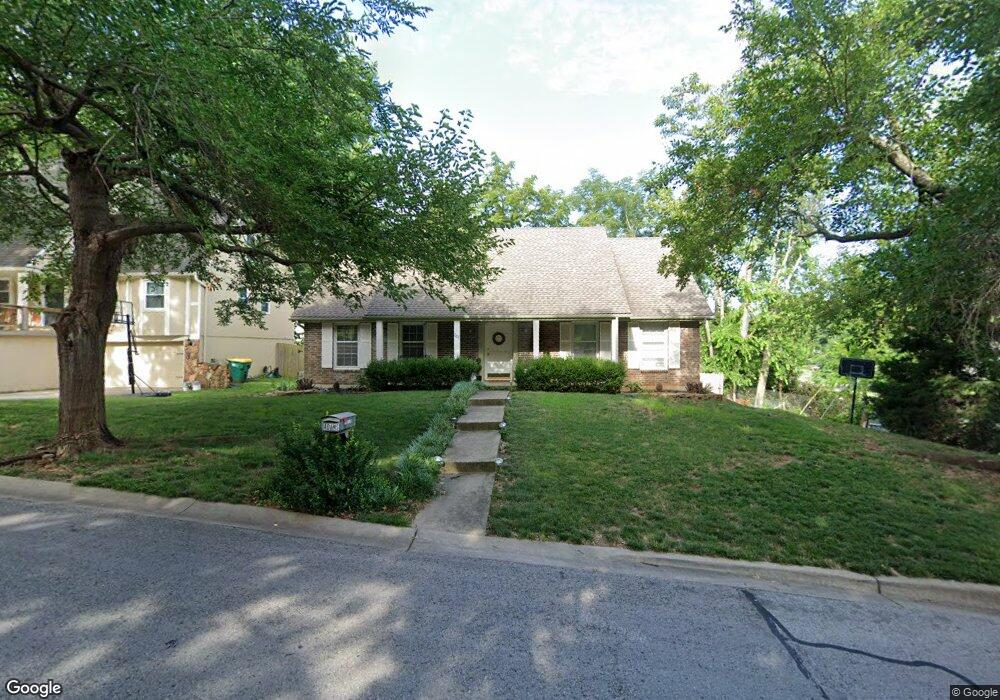
7102 Long Ave Shawnee, KS 66216
Estimated Value: $395,110 - $413,000
5
Beds
3
Baths
2,150
Sq Ft
$189/Sq Ft
Est. Value
About This Home
This home is located at 7102 Long Ave, Shawnee, KS 66216 and is currently estimated at $405,278, approximately $188 per square foot. 7102 Long Ave is a home located in Johnson County with nearby schools including Rhein Benninghoven Elementary School, Trailridge Middle School, and Shawnee Mission Northwest High School.
Ownership History
Date
Name
Owned For
Owner Type
Purchase Details
Closed on
Jun 25, 2016
Sold by
Adams Ryan
Bought by
Adams Ryan and Adams Jennifer
Current Estimated Value
Purchase Details
Closed on
Apr 14, 2011
Sold by
Federal Home Loan Mortgage Corporation
Bought by
Adams Ryan
Home Financials for this Owner
Home Financials are based on the most recent Mortgage that was taken out on this home.
Original Mortgage
$140,349
Interest Rate
4.87%
Mortgage Type
FHA
Purchase Details
Closed on
Aug 5, 2010
Sold by
Hartz Russell P
Bought by
Federal Home Loan Mortgage Corporation
Purchase Details
Closed on
Nov 22, 2004
Sold by
Hartz Audry L
Bought by
Hartz Ii Russell P
Home Financials for this Owner
Home Financials are based on the most recent Mortgage that was taken out on this home.
Original Mortgage
$152,000
Interest Rate
5.25%
Mortgage Type
Adjustable Rate Mortgage/ARM
Create a Home Valuation Report for This Property
The Home Valuation Report is an in-depth analysis detailing your home's value as well as a comparison with similar homes in the area
Home Values in the Area
Average Home Value in this Area
Purchase History
| Date | Buyer | Sale Price | Title Company |
|---|---|---|---|
| Adams Ryan | -- | None Available | |
| Adams Ryan | -- | Stewart Title | |
| Federal Home Loan Mortgage Corporation | $165,000 | None Available | |
| Hartz Ii Russell P | -- | None Available |
Source: Public Records
Mortgage History
| Date | Status | Borrower | Loan Amount |
|---|---|---|---|
| Previous Owner | Adams Ryan | $140,349 | |
| Previous Owner | Hartz Ii Russell P | $28,500 | |
| Previous Owner | Hartz Ii Russell P | $152,000 |
Source: Public Records
Tax History Compared to Growth
Tax History
| Year | Tax Paid | Tax Assessment Tax Assessment Total Assessment is a certain percentage of the fair market value that is determined by local assessors to be the total taxable value of land and additions on the property. | Land | Improvement |
|---|---|---|---|---|
| 2024 | $3,571 | $33,890 | $7,346 | $26,544 |
| 2023 | $3,744 | $34,937 | $7,346 | $27,591 |
| 2022 | $3,153 | $29,337 | $6,383 | $22,954 |
| 2021 | $3,191 | $27,796 | $5,802 | $21,994 |
| 2020 | $2,979 | $25,599 | $5,272 | $20,327 |
| 2019 | $2,754 | $23,644 | $4,164 | $19,480 |
| 2018 | $2,706 | $23,138 | $4,164 | $18,974 |
| 2017 | $2,422 | $20,367 | $3,617 | $16,750 |
| 2016 | $2,259 | $18,745 | $3,617 | $15,128 |
| 2015 | $1,983 | $17,158 | $3,617 | $13,541 |
| 2013 | -- | $16,135 | $3,617 | $12,518 |
Source: Public Records
Map
Nearby Homes
- 7130 Westgate St
- Augusta Plan at Kenneth Estates
- Newport Plan at Kenneth Estates
- Rosemount II Plan at Kenneth Estates
- The Avala Villa Plan at Kenneth Estates
- The Rosemount Villa Plan at Kenneth Estates
- Catalina II Plan at Kenneth Estates
- The Avala Plan at Kenneth Estates
- 12811 W 71st St
- 12403 W 72nd Terrace
- 7115 Richards Dr
- 7105 Richards Dr
- 13100 W 72nd St
- 12300 W 67th Terrace
- 7107 Garnett St
- 7526 Monrovia St
- 12914 W 67th St
- 6610 Halsey St
- 6564 Charles St
- 11637 W 68th Terrace
- 7106 Long Ave
- 7110 Long Ave
- 12407 W 71st St
- 7026 Long Ave
- 12408 W 71st St
- 12408 W 71st Terrace
- 7114 Long Ave
- 12401 W 71st St
- 7114 Westgate St
- 7027 Long Ave
- 12402 W 71st Terrace
- 7118 Long Ave
- 7022 Long Ave
- 12402 W 71st St
- 12600 W 70th Terrace
- 12321 W 71st St
- 12403 W 71st Terrace
- 12324 W 71st Terrace
- 7023 Long Ave
- 7122 Long Ave