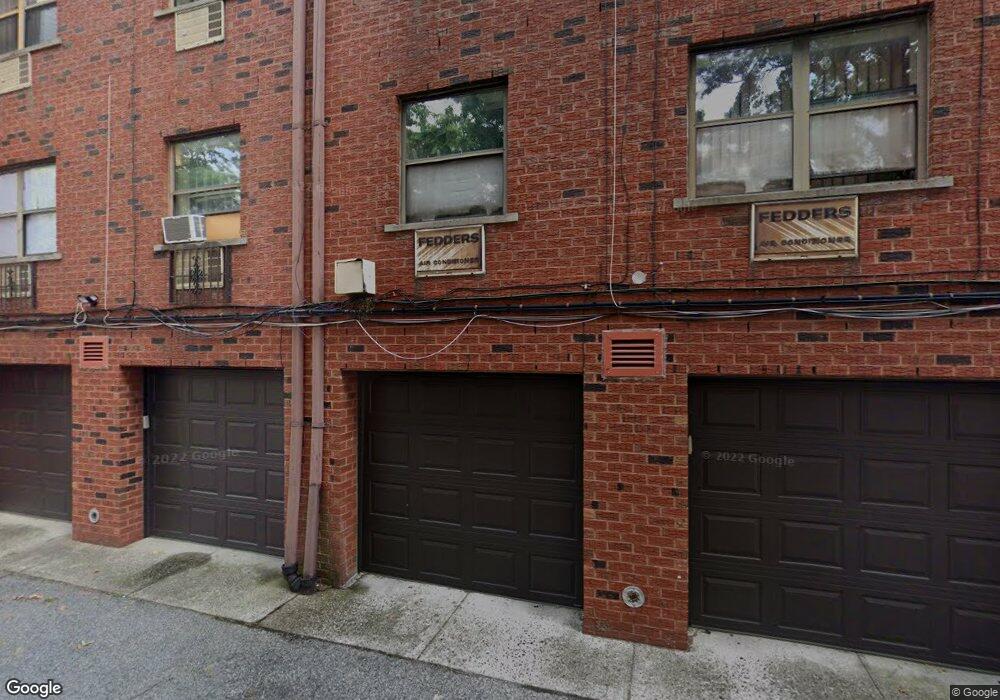
7106 Sutton Place Unit 1 Fresh Meadows, NY 11365
Pomonok NeighborhoodEstimated Value: $586,000 - $688,191
--
Bed
--
Bath
1,260
Sq Ft
$516/Sq Ft
Est. Value
About This Home
This home is located at 7106 Sutton Place Unit 1, Fresh Meadows, NY 11365 and is currently estimated at $649,798, approximately $515 per square foot. 7106 Sutton Place Unit 1 is a home located in Queens County with nearby schools including I.S. 250 - The Robert F. Kennedy Community Middle School.
Ownership History
Date
Name
Owned For
Owner Type
Purchase Details
Closed on
Feb 11, 2025
Sold by
Cook Ubaldina I
Bought by
71-061 Sutton Place Llc
Current Estimated Value
Purchase Details
Closed on
Feb 16, 2007
Sold by
Gutierrez Alfonso and Sanchez Licet
Bought by
Cook Ubaldina I
Home Financials for this Owner
Home Financials are based on the most recent Mortgage that was taken out on this home.
Original Mortgage
$240,000
Interest Rate
6.27%
Mortgage Type
Purchase Money Mortgage
Purchase Details
Closed on
Jul 17, 1997
Sold by
Bhatia Om P
Bought by
Gutierrez Alfonso and Sanchez Licet
Home Financials for this Owner
Home Financials are based on the most recent Mortgage that was taken out on this home.
Original Mortgage
$0
Interest Rate
7.47%
Create a Home Valuation Report for This Property
The Home Valuation Report is an in-depth analysis detailing your home's value as well as a comparison with similar homes in the area
Home Values in the Area
Average Home Value in this Area
Purchase History
| Date | Buyer | Sale Price | Title Company |
|---|---|---|---|
| 71-061 Sutton Place Llc | $655,000 | -- | |
| 71-061 Sutton Place Llc | $655,000 | -- | |
| Cook Ubaldina I | $300,000 | -- | |
| Cook Ubaldina I | $300,000 | -- | |
| Gutierrez Alfonso | -- | -- | |
| Gutierrez Alfonso | -- | -- |
Source: Public Records
Mortgage History
| Date | Status | Borrower | Loan Amount |
|---|---|---|---|
| Previous Owner | Cook Ubaldina I | $240,000 | |
| Previous Owner | Gutierrez Alfonso | $0 |
Source: Public Records
Tax History Compared to Growth
Tax History
| Year | Tax Paid | Tax Assessment Tax Assessment Total Assessment is a certain percentage of the fair market value that is determined by local assessors to be the total taxable value of land and additions on the property. | Land | Improvement |
|---|---|---|---|---|
| 2025 | $5,734 | $28,766 | $380 | $28,386 |
| 2024 | $5,734 | $28,548 | $397 | $28,151 |
| 2023 | $5,409 | $26,933 | $359 | $26,574 |
| 2022 | $5,073 | $35,999 | $515 | $35,484 |
| 2021 | $5,045 | $32,982 | $515 | $32,467 |
| 2020 | $5,074 | $34,102 | $515 | $33,587 |
| 2019 | $4,977 | $31,132 | $515 | $30,617 |
| 2018 | $4,575 | $22,444 | $382 | $22,062 |
| 2017 | $4,317 | $21,175 | $369 | $20,806 |
| 2016 | $3,994 | $21,175 | $369 | $20,806 |
| 2015 | $2,409 | $19,977 | $382 | $19,595 |
| 2014 | $2,409 | $19,826 | $404 | $19,422 |
Source: Public Records
Map
Nearby Homes
- 7111 Sutton Place Unit 3
- 71-18 Sutton Place Unit 3
- 7129 Sutton Place Unit 3
- 71-28 Sutton Place Unit 3
- 71-33 162nd St Unit 4B
- 71-24 163rd St Unit 5A
- 71-34 163rd St Unit 3
- 163-07 72nd Ave Unit 5C
- 163-07 72nd Ave Unit 5A
- 163-07 72nd Ave Unit 2D
- 163-07 72nd Ave Unit 2G
- 163-07 72nd Ave Unit 4E
- 163-07 72nd Ave Unit 2C
- 163-07 72nd Ave Unit 5F
- 163-07 72nd Ave Unit 5b
- 163-07 72nd Ave Unit 2A
- 163-07 72nd Ave Unit 4H
- 7177 159th St Unit 205
- 7177 159th St Unit 3D
- 72-05 164th St
- 71-08 Sutton Place Unit 3
- 7108 Sutton Place Unit 3
- 7108 Sutton Place Unit 2
- 7108 Sutton Place Unit 1
- 71-08 Sutton Place
- 7108 Sutton Place Unit 3
- 7106 Sutton Place Unit 2Fl
- 7106 Sutton Place Unit 3
- 7106 Sutton Place Unit 2
- 7110 Sutton Place Unit 3
- 7110 Sutton Place Unit 3
- 7110 Sutton Place Unit 2
- 7110 Sutton Place Unit 1
- 7110 Sutton Place
- 7110 Sutton Place Unit 2
- 7110 Sutton Place Unit 1st FL
- 71-12 Sutton Place Unit 1
- 7104 Sutton Place Unit 1 A
- 7104 Sutton Place Unit 3
- 7104 Sutton Place Unit 2