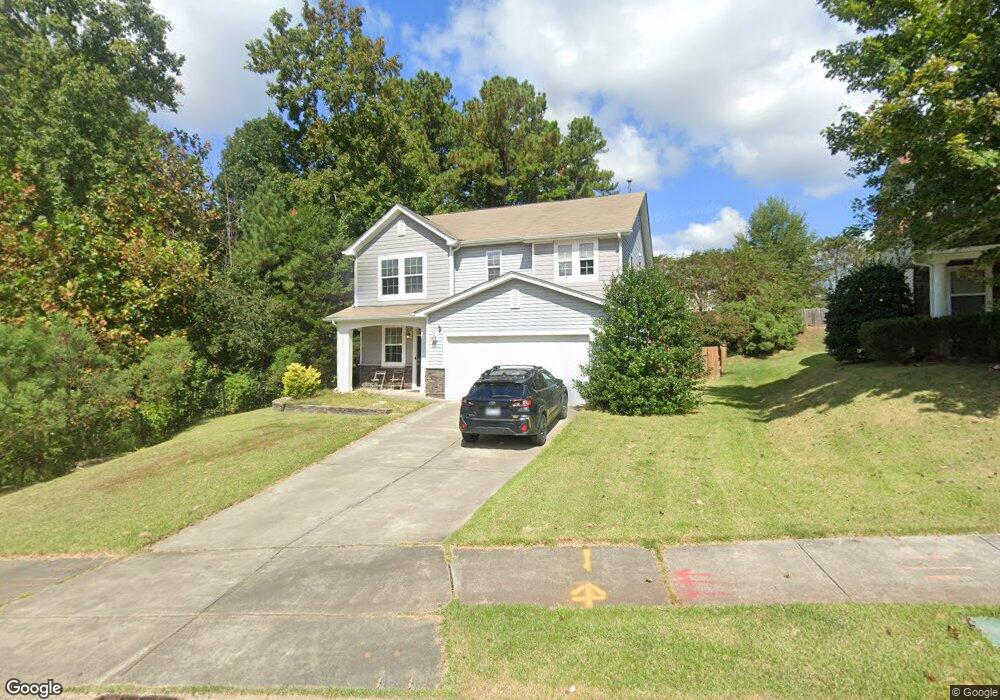
711 Ashburn Ln Durham, NC 27703
Eastern Durham NeighborhoodEstimated Value: $407,000 - $446,000
3
Beds
3
Baths
2,239
Sq Ft
$193/Sq Ft
Est. Value
About This Home
This home is located at 711 Ashburn Ln, Durham, NC 27703 and is currently estimated at $431,435, approximately $192 per square foot. 711 Ashburn Ln is a home located in Durham County with nearby schools including Spring Valley Elementary School, John W Neal Middle School, and Southern School of Energy & Sustainability.
Ownership History
Date
Name
Owned For
Owner Type
Purchase Details
Closed on
Jan 29, 2020
Sold by
Sph One Lllp
Bought by
Viruet Lindsey Martin and Viruet Frank Thomas
Current Estimated Value
Home Financials for this Owner
Home Financials are based on the most recent Mortgage that was taken out on this home.
Original Mortgage
$262,753
Outstanding Balance
$232,649
Interest Rate
3.6%
Mortgage Type
New Conventional
Estimated Equity
$198,786
Purchase Details
Closed on
Dec 20, 2019
Sold by
Willing Galan
Bought by
Sph One Lllp
Home Financials for this Owner
Home Financials are based on the most recent Mortgage that was taken out on this home.
Original Mortgage
$262,753
Outstanding Balance
$232,649
Interest Rate
3.6%
Mortgage Type
New Conventional
Estimated Equity
$198,786
Purchase Details
Closed on
Aug 26, 2009
Sold by
Kb Home Raleigh Durham Inc
Bought by
Willig Galan
Home Financials for this Owner
Home Financials are based on the most recent Mortgage that was taken out on this home.
Original Mortgage
$206,095
Interest Rate
5.19%
Mortgage Type
FHA
Create a Home Valuation Report for This Property
The Home Valuation Report is an in-depth analysis detailing your home's value as well as a comparison with similar homes in the area
Home Values in the Area
Average Home Value in this Area
Purchase History
| Date | Buyer | Sale Price | Title Company |
|---|---|---|---|
| Viruet Lindsey Martin | $280,000 | None Available | |
| Sph One Lllp | $264,500 | None Available | |
| Willig Galan | $210,000 | None Available |
Source: Public Records
Mortgage History
| Date | Status | Borrower | Loan Amount |
|---|---|---|---|
| Open | Viruet Lindsey Martin | $262,753 | |
| Previous Owner | Willig Galan | $206,095 |
Source: Public Records
Tax History Compared to Growth
Tax History
| Year | Tax Paid | Tax Assessment Tax Assessment Total Assessment is a certain percentage of the fair market value that is determined by local assessors to be the total taxable value of land and additions on the property. | Land | Improvement |
|---|---|---|---|---|
| 2025 | $4,411 | $444,949 | $108,500 | $336,449 |
| 2024 | $3,268 | $234,311 | $49,760 | $184,551 |
| 2023 | $3,069 | $234,311 | $49,760 | $184,551 |
| 2022 | $2,999 | $234,311 | $49,760 | $184,551 |
| 2021 | $2,985 | $234,311 | $49,760 | $184,551 |
| 2020 | $2,915 | $234,311 | $49,760 | $184,551 |
| 2019 | $2,915 | $234,311 | $49,760 | $184,551 |
| 2018 | $2,720 | $200,484 | $37,320 | $163,164 |
| 2017 | $2,700 | $200,484 | $37,320 | $163,164 |
| 2016 | $2,609 | $200,484 | $37,320 | $163,164 |
| 2015 | $2,899 | $209,428 | $49,085 | $160,343 |
| 2014 | $2,899 | $209,428 | $49,085 | $160,343 |
Source: Public Records
Map
Nearby Homes
- 309 Rondelay Dr
- 634 Conover Rd
- 2 Red Sage Ct
- 641 Conover Rd Unit B
- 619 Ashburn Ln
- 620 Conover Rd
- 626 Ashburn Ln
- 633 Conover Rd
- 631 Conover Rd
- 613 Ashburn Ln
- 629 Conover Rd
- 610 Ashburn Ln
- 121 English Ivy Dr
- 303 Holly Blossom Dr
- 339 Olive Branch Rd
- 1130 Arbor Edge Ln
- 621 Wellwater Ave
- 316 Vintage Holly Dr
- 204 Hillview Dr
- 1417 Underbrush Dr
- 713 Ashburn Ln
- 715 Ashburn Ln
- 718 Weathervane Dr
- 720 Weathervane Dr
- 716 Weathervane Dr
- 712 Ashburn Ln
- 714 Ashburn Ln
- 722 Weathervane Dr
- 714 Weathervane Dr
- 712 Weathervane Dr
- 306 Rondelay Dr
- 209 Rondelay Dr
- 207 Rondelay Dr
- 211 Rondelay Dr
- 701 Ashburn Ln
- 205 Rondelay Dr
- 303 Rondelay Dr
- 715 Weathervane Dr
- 719 Weathervane Dr
- 305 Rondelay Dr