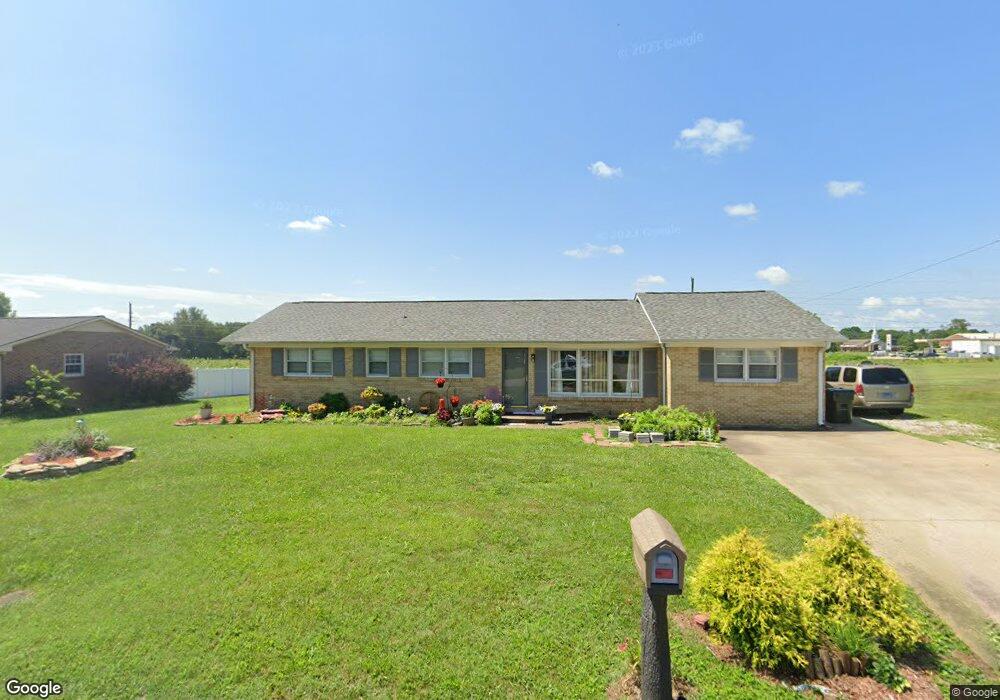
711 Lloyd St Lawrenceburg, TN 38464
Estimated Value: $223,949 - $272,000
--
Bed
2
Baths
1,815
Sq Ft
$140/Sq Ft
Est. Value
About This Home
This home is located at 711 Lloyd St, Lawrenceburg, TN 38464 and is currently estimated at $254,237, approximately $140 per square foot. 711 Lloyd St is a home located in Lawrence County with nearby schools including Ingram Sowell Elementary School, Lawrenceburg Public Elementary School, and David Crockett Elementary School.
Ownership History
Date
Name
Owned For
Owner Type
Purchase Details
Closed on
Dec 13, 2019
Sold by
Hight Ernest Kevin and Hight Leslie Paige
Bought by
Penix Janis L
Current Estimated Value
Purchase Details
Closed on
Feb 22, 2016
Sold by
Berryhill Donald J
Bought by
Hight Ernest Kevin and Hight Leslie Paige
Home Financials for this Owner
Home Financials are based on the most recent Mortgage that was taken out on this home.
Original Mortgage
$115,000
Interest Rate
3.81%
Mortgage Type
New Conventional
Purchase Details
Closed on
May 15, 2006
Sold by
Berryhill Jasper L
Bought by
Berryhill Donald J
Purchase Details
Closed on
Jun 12, 2003
Bought by
Berryhill Jasper L and Berryhill Martha J
Purchase Details
Closed on
Oct 3, 1978
Bought by
Berry Hill Jasper L and Berry Martha
Create a Home Valuation Report for This Property
The Home Valuation Report is an in-depth analysis detailing your home's value as well as a comparison with similar homes in the area
Home Values in the Area
Average Home Value in this Area
Purchase History
| Date | Buyer | Sale Price | Title Company |
|---|---|---|---|
| Penix Janis L | $135,000 | None Available | |
| Hight Ernest Kevin | $129,750 | -- | |
| Berryhill Donald J | $40,000 | -- | |
| Berryhill Jasper L | -- | -- | |
| Berry Hill Jasper L | -- | -- |
Source: Public Records
Mortgage History
| Date | Status | Borrower | Loan Amount |
|---|---|---|---|
| Previous Owner | Hight Ernest Kevin | $115,000 |
Source: Public Records
Tax History Compared to Growth
Tax History
| Year | Tax Paid | Tax Assessment Tax Assessment Total Assessment is a certain percentage of the fair market value that is determined by local assessors to be the total taxable value of land and additions on the property. | Land | Improvement |
|---|---|---|---|---|
| 2025 | $1,407 | $45,275 | $0 | $0 |
| 2024 | $1,407 | $45,275 | $3,125 | $42,150 |
| 2023 | $1,407 | $45,275 | $3,125 | $42,150 |
| 2022 | $1,407 | $45,275 | $3,125 | $42,150 |
| 2021 | $1,365 | $31,075 | $2,500 | $28,575 |
| 2020 | $1,365 | $31,075 | $2,500 | $28,575 |
| 2019 | $1,193 | $27,125 | $2,500 | $24,625 |
| 2018 | $1,193 | $27,125 | $2,500 | $24,625 |
| 2017 | $1,193 | $27,125 | $2,500 | $24,625 |
| 2016 | $1,193 | $27,125 | $2,500 | $24,625 |
| 2015 | $855 | $20,550 | $2,500 | $18,050 |
| 2014 | $826 | $19,850 | $2,500 | $17,350 |
Source: Public Records
Map
Nearby Homes