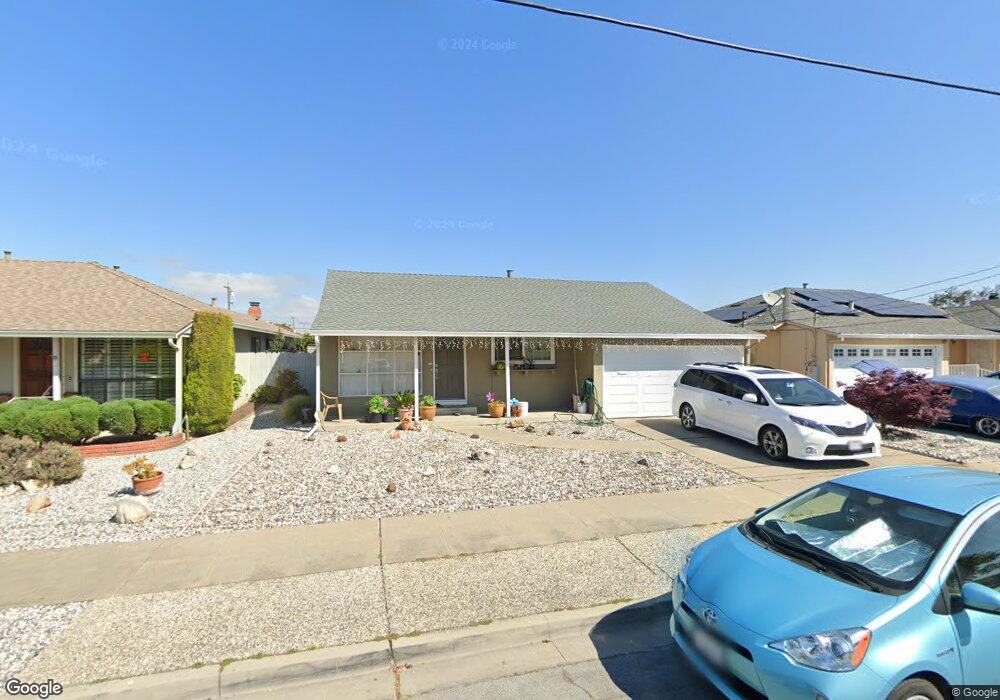
711 Moraga Dr San Leandro, CA 94578
Floresta Gardens-Bradrick NeighborhoodEstimated Value: $798,007 - $856,000
3
Beds
1
Bath
1,114
Sq Ft
$740/Sq Ft
Est. Value
About This Home
This home is located at 711 Moraga Dr, San Leandro, CA 94578 and is currently estimated at $824,002, approximately $739 per square foot. 711 Moraga Dr is a home located in Alameda County with nearby schools including Monroe Elementary School, John Muir Middle School, and San Leandro High School.
Ownership History
Date
Name
Owned For
Owner Type
Purchase Details
Closed on
Sep 17, 2019
Sold by
Cheung Suet Y
Bought by
Yang Kai and Wu Caixia
Current Estimated Value
Home Financials for this Owner
Home Financials are based on the most recent Mortgage that was taken out on this home.
Original Mortgage
$505,000
Outstanding Balance
$442,341
Interest Rate
3.6%
Mortgage Type
New Conventional
Estimated Equity
$381,661
Purchase Details
Closed on
Jan 25, 2013
Sold by
Orozco Rigoberto and Llamas Carmen A
Bought by
Cheung Suet Y
Home Financials for this Owner
Home Financials are based on the most recent Mortgage that was taken out on this home.
Original Mortgage
$242,100
Interest Rate
3.33%
Mortgage Type
New Conventional
Purchase Details
Closed on
Nov 4, 2005
Sold by
Kanalakis Renee and Revocable Trust Of John J Lest
Bought by
Orozco Rigoberto and Llamas Carmen A
Home Financials for this Owner
Home Financials are based on the most recent Mortgage that was taken out on this home.
Original Mortgage
$432,000
Interest Rate
5.75%
Mortgage Type
Purchase Money Mortgage
Create a Home Valuation Report for This Property
The Home Valuation Report is an in-depth analysis detailing your home's value as well as a comparison with similar homes in the area
Home Values in the Area
Average Home Value in this Area
Purchase History
| Date | Buyer | Sale Price | Title Company |
|---|---|---|---|
| Yang Kai | $675,000 | First American Title Company | |
| Cheung Suet Y | $269,000 | North American Title Company | |
| Orozco Rigoberto | $540,000 | Old Republic Title Company |
Source: Public Records
Mortgage History
| Date | Status | Borrower | Loan Amount |
|---|---|---|---|
| Open | Yang Kai | $505,000 | |
| Previous Owner | Cheung Suet Y | $242,100 | |
| Previous Owner | Orozco Rigoberto | $432,000 |
Source: Public Records
Tax History Compared to Growth
Tax History
| Year | Tax Paid | Tax Assessment Tax Assessment Total Assessment is a certain percentage of the fair market value that is determined by local assessors to be the total taxable value of land and additions on the property. | Land | Improvement |
|---|---|---|---|---|
| 2025 | $9,706 | $731,200 | $221,460 | $516,740 |
| 2024 | $9,706 | $716,727 | $217,118 | $506,609 |
| 2023 | $9,641 | $709,538 | $212,861 | $496,677 |
| 2022 | $9,373 | $688,627 | $208,688 | $486,939 |
| 2021 | $9,084 | $674,992 | $204,597 | $477,395 |
| 2020 | $8,849 | $675,000 | $202,500 | $472,500 |
| 2019 | $5,025 | $358,763 | $107,629 | $251,134 |
| 2018 | $4,886 | $351,730 | $105,519 | $246,211 |
| 2017 | $4,808 | $344,834 | $103,450 | $241,384 |
| 2016 | $4,564 | $338,074 | $101,422 | $236,652 |
| 2015 | $4,484 | $332,997 | $99,899 | $233,098 |
| 2014 | $4,446 | $326,474 | $97,942 | $228,532 |
Source: Public Records
Map
Nearby Homes
- 774 Hamlin Way
- 3811 Yorkshire St Unit 2
- 3419 Del Valle Cir
- 3411 Del Monte Way
- 3847 Yorkshire St Unit 8
- 585 Majestic Way Unit 40
- 365 Caliente Cir
- 829 Crespi Dr
- 1207 147th Ave Unit D
- 14875 Western Ave
- 391 Anza Way
- 1255 Primrose Dr
- 14666 Wiley St
- 688 Garside Ct
- 1315 Mersey Ave
- 1311 Hubbard Ave
- 14828 Martell Ave
- 15009 Kesterson St
- 475 Nabor St
- 821 Coburn Ct