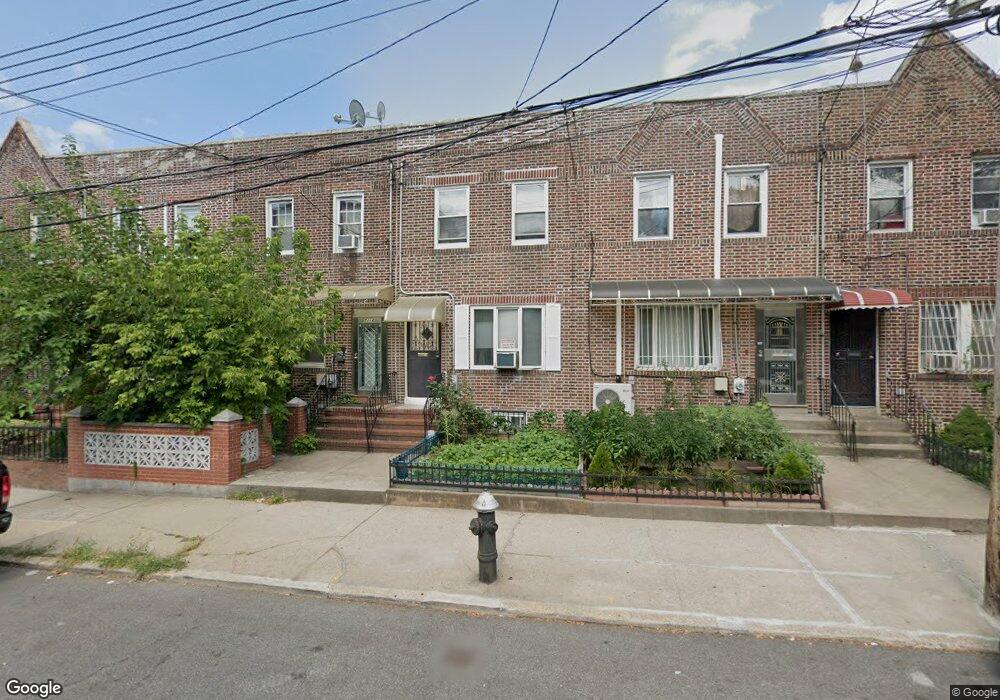
7114 8th Ave Brooklyn, NY 11228
Dyker Heights NeighborhoodEstimated Value: $898,413 - $1,051,000
--
Bed
--
Bath
1,024
Sq Ft
$959/Sq Ft
Est. Value
About This Home
This home is located at 7114 8th Ave, Brooklyn, NY 11228 and is currently estimated at $982,103, approximately $959 per square foot. 7114 8th Ave is a home located in Kings County with nearby schools including Junior High School 259 William McKinley, Fort Hamilton High School, and St Ephrem School.
Ownership History
Date
Name
Owned For
Owner Type
Purchase Details
Closed on
Jul 18, 2016
Sold by
Huang Dan Tong
Bought by
Huang Dan Tong and Ruan Diane
Current Estimated Value
Purchase Details
Closed on
Jun 9, 1999
Sold by
Rodland Martin
Bought by
Ruan Jin Fu and Huang Dan Tong
Home Financials for this Owner
Home Financials are based on the most recent Mortgage that was taken out on this home.
Original Mortgage
$80,000
Interest Rate
7.83%
Create a Home Valuation Report for This Property
The Home Valuation Report is an in-depth analysis detailing your home's value as well as a comparison with similar homes in the area
Home Values in the Area
Average Home Value in this Area
Purchase History
| Date | Buyer | Sale Price | Title Company |
|---|---|---|---|
| Huang Dan Tong | -- | -- | |
| Ruan Jin Fu | $199,000 | First American Title Ins Co |
Source: Public Records
Mortgage History
| Date | Status | Borrower | Loan Amount |
|---|---|---|---|
| Previous Owner | Ruan Jin Fu | $80,000 |
Source: Public Records
Tax History Compared to Growth
Tax History
| Year | Tax Paid | Tax Assessment Tax Assessment Total Assessment is a certain percentage of the fair market value that is determined by local assessors to be the total taxable value of land and additions on the property. | Land | Improvement |
|---|---|---|---|---|
| 2025 | $5,945 | $59,760 | $12,960 | $46,800 |
| 2024 | $5,945 | $54,600 | $12,960 | $41,640 |
| 2023 | $5,671 | $51,060 | $12,960 | $38,100 |
| 2022 | $5,575 | $49,800 | $12,960 | $36,840 |
| 2021 | $5,832 | $50,520 | $12,960 | $37,560 |
| 2020 | $4,374 | $49,440 | $12,960 | $36,480 |
| 2019 | $5,160 | $49,440 | $12,960 | $36,480 |
| 2018 | $4,744 | $23,271 | $6,013 | $17,258 |
| 2017 | $4,444 | $23,271 | $7,030 | $16,241 |
| 2016 | $4,307 | $23,095 | $7,794 | $15,301 |
| 2015 | $2,428 | $21,788 | $10,672 | $11,116 |
| 2014 | $2,428 | $20,556 | $10,725 | $9,831 |
Source: Public Records
Map
Nearby Homes