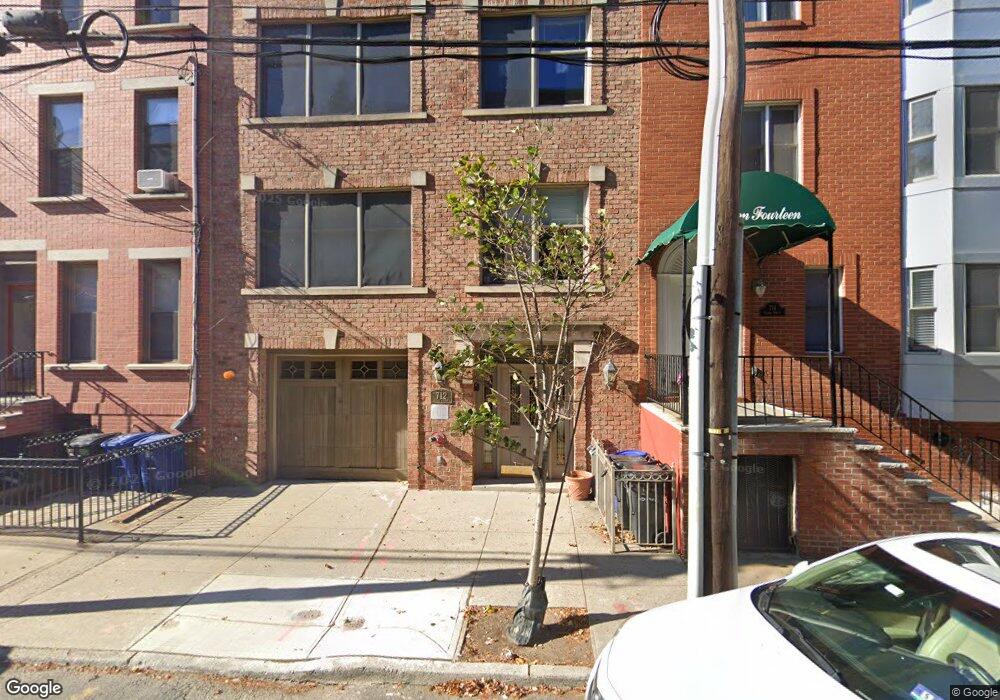
712 Grand St Unit 2 Hoboken, NJ 07030
Estimated Value: $1,076,392 - $1,252,000
3
Beds
2
Baths
1,286
Sq Ft
$906/Sq Ft
Est. Value
About This Home
This home is located at 712 Grand St Unit 2, Hoboken, NJ 07030 and is currently estimated at $1,165,348, approximately $906 per square foot. 712 Grand St Unit 2 is a home located in Hudson County with nearby schools including Hoboken High School and Jersey City Global Charter School.
Ownership History
Date
Name
Owned For
Owner Type
Purchase Details
Closed on
Aug 8, 2019
Sold by
Konzelmann John Scott and Konzelmann Danielle
Bought by
Wang Song and Ni Guisi
Current Estimated Value
Home Financials for this Owner
Home Financials are based on the most recent Mortgage that was taken out on this home.
Original Mortgage
$744,000
Outstanding Balance
$641,891
Interest Rate
3%
Mortgage Type
New Conventional
Estimated Equity
$523,457
Purchase Details
Closed on
Oct 24, 2017
Sold by
Cohen Michael and Cohen Lauren
Bought by
Konzelmann John Scott and Harrris Baker Danielle
Home Financials for this Owner
Home Financials are based on the most recent Mortgage that was taken out on this home.
Original Mortgage
$596,250
Interest Rate
3%
Mortgage Type
Adjustable Rate Mortgage/ARM
Purchase Details
Closed on
Sep 23, 2010
Sold by
Nuara John
Bought by
Cohen Michael
Home Financials for this Owner
Home Financials are based on the most recent Mortgage that was taken out on this home.
Original Mortgage
$400,000
Interest Rate
4.37%
Mortgage Type
Purchase Money Mortgage
Create a Home Valuation Report for This Property
The Home Valuation Report is an in-depth analysis detailing your home's value as well as a comparison with similar homes in the area
Home Values in the Area
Average Home Value in this Area
Purchase History
| Date | Buyer | Sale Price | Title Company |
|---|---|---|---|
| Wang Song | $930,000 | None Available | |
| Konzelmann John Scott | $795,000 | Multiple | |
| Cohen Michael | $500,000 | -- |
Source: Public Records
Mortgage History
| Date | Status | Borrower | Loan Amount |
|---|---|---|---|
| Open | Wang Song | $744,000 | |
| Previous Owner | Konzelmann John Scott | $596,250 | |
| Previous Owner | Cohen Michael | $400,000 |
Source: Public Records
Tax History Compared to Growth
Tax History
| Year | Tax Paid | Tax Assessment Tax Assessment Total Assessment is a certain percentage of the fair market value that is determined by local assessors to be the total taxable value of land and additions on the property. | Land | Improvement |
|---|---|---|---|---|
| 2025 | $10,672 | $604,300 | $205,900 | $398,400 |
| 2024 | $9,844 | $604,300 | $205,900 | $398,400 |
| 2023 | $9,844 | $604,300 | $205,900 | $398,400 |
| 2022 | $9,675 | $604,300 | $205,900 | $398,400 |
| 2021 | $9,669 | $604,300 | $205,900 | $398,400 |
| 2020 | $9,735 | $604,300 | $205,900 | $398,400 |
| 2019 | $9,663 | $604,300 | $205,900 | $398,400 |
| 2018 | $9,232 | $584,300 | $205,900 | $378,400 |
| 2017 | $9,302 | $584,300 | $205,900 | $378,400 |
| 2016 | $9,062 | $584,300 | $205,900 | $378,400 |
| 2015 | $8,747 | $584,300 | $205,900 | $378,400 |
| 2014 | $8,344 | $584,300 | $205,900 | $378,400 |
Source: Public Records
Map
Nearby Homes
- 720 Clinton St Unit 508
- 720 Clinton St Unit 603
- 719 Adams St Unit 2R
- 717 Adams St Unit 4R
- 123 Willow Terrace
- 610 Clinton St Unit 2E
- 264 7th St Unit 3
- 638 Park Ave
- 815 Willow Ave Unit 2R
- 703 Park Ave Unit 1
- 818 Jefferson St Unit 1C
- 528 Adams St Unit 2
- 911 Willow Ave Unit 1
- 523 Jefferson St Unit 3
- 209 6th St Unit 200
- 704 Bloomfield St Unit 2
- 919 Park Ave Unit 1R
- 422 Grand St Unit 5
- 422 Grand St Unit 3
- 906 Garden St
- 712 Grand St
- 712 Grand St Unit 3
- 712 Grand St
- 712 Grand St
- 712 Grand St Unit 1
- 712 Grand St Unit 4
- 715 Grand St Unit PH 4A
- 715 Grand St Unit 3D
- 715 Grand St Unit 2E
- 715 Grand St Unit 4D
- 715 Grand St Unit 3B
- 715 Grand St Unit 3A
- 715 Grand St Unit 4A
- 715 Grand St Unit 4B
- 715 Grand St Unit 4E
- 715 Grand St Unit 3C
- 715 Grand St
- 715 Grand St Unit E
- 701 Grand St Unit 709
- 701 Grand St Unit 709