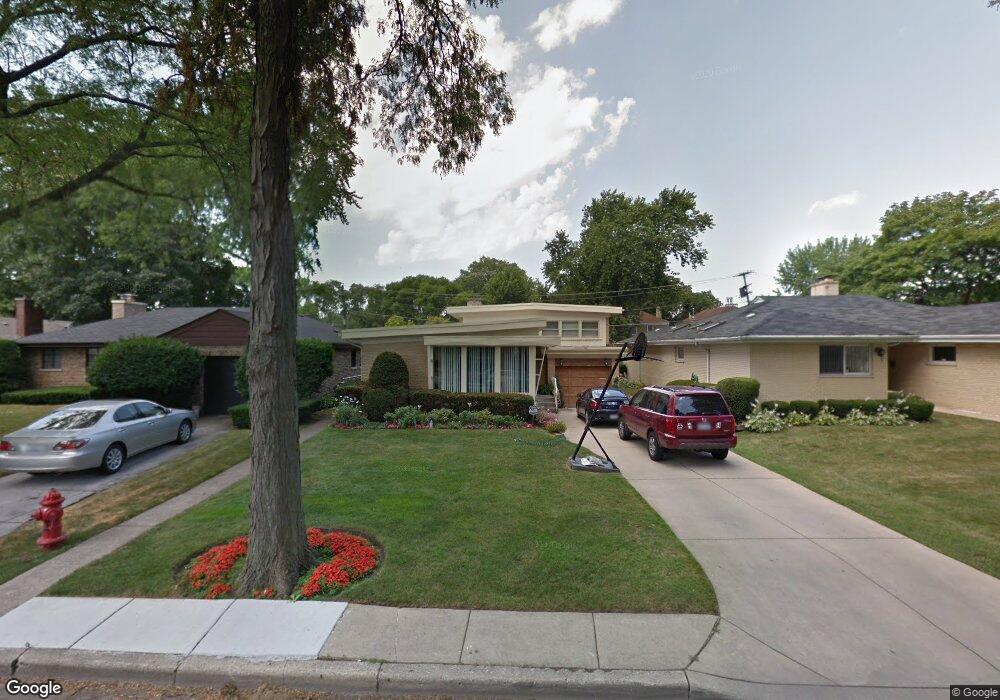
7128 N Karlov Ave Lincolnwood, IL 60712
Estimated Value: $518,000 - $588,000
3
Beds
2
Baths
2,288
Sq Ft
$240/Sq Ft
Est. Value
About This Home
This home is located at 7128 N Karlov Ave, Lincolnwood, IL 60712 and is currently estimated at $548,208, approximately $239 per square foot. 7128 N Karlov Ave is a home located in Cook County with nearby schools including Todd Hall Elementary School, Rutledge Hall Elementary School, and Lincoln Hall Middle School.
Ownership History
Date
Name
Owned For
Owner Type
Purchase Details
Closed on
Jan 28, 2022
Sold by
Dwyer Bonnie and Dwyer Y
Bought by
Dwyer Christopher and Pehar Milana
Current Estimated Value
Home Financials for this Owner
Home Financials are based on the most recent Mortgage that was taken out on this home.
Original Mortgage
$384,120
Outstanding Balance
$355,247
Interest Rate
3.38%
Estimated Equity
$192,961
Purchase Details
Closed on
Jan 20, 2022
Sold by
Dwyer Bonnie and Dwyer Y
Bought by
Dwyer Christopher and Pehar Milana
Home Financials for this Owner
Home Financials are based on the most recent Mortgage that was taken out on this home.
Original Mortgage
$384,120
Outstanding Balance
$355,247
Interest Rate
3.38%
Estimated Equity
$192,961
Purchase Details
Closed on
Jun 23, 1995
Sold by
First National Bank Of La Grange
Bought by
Dwyer Bonnie
Create a Home Valuation Report for This Property
The Home Valuation Report is an in-depth analysis detailing your home's value as well as a comparison with similar homes in the area
Home Values in the Area
Average Home Value in this Area
Purchase History
| Date | Buyer | Sale Price | Title Company |
|---|---|---|---|
| Dwyer Christopher | -- | -- | |
| Dwyer Christopher | -- | -- | |
| Dwyer Christopher | -- | -- | |
| Dwyer Bonnie | $215,000 | -- |
Source: Public Records
Mortgage History
| Date | Status | Borrower | Loan Amount |
|---|---|---|---|
| Open | Dwyer Christopher | $384,120 |
Source: Public Records
Tax History Compared to Growth
Tax History
| Year | Tax Paid | Tax Assessment Tax Assessment Total Assessment is a certain percentage of the fair market value that is determined by local assessors to be the total taxable value of land and additions on the property. | Land | Improvement |
|---|---|---|---|---|
| 2024 | $10,071 | $40,978 | $7,749 | $33,229 |
| 2023 | $9,647 | $40,978 | $7,749 | $33,229 |
| 2022 | $9,647 | $40,978 | $7,749 | $33,229 |
| 2021 | $8,225 | $31,681 | $5,535 | $26,146 |
| 2020 | $8,139 | $31,681 | $5,535 | $26,146 |
| 2019 | $8,220 | $35,202 | $5,535 | $29,667 |
| 2018 | $7,552 | $31,265 | $4,843 | $26,422 |
| 2017 | $7,599 | $31,265 | $4,843 | $26,422 |
| 2016 | $7,997 | $33,369 | $4,843 | $28,526 |
| 2015 | $7,312 | $28,752 | $4,151 | $24,601 |
| 2014 | $7,031 | $28,752 | $4,151 | $24,601 |
| 2013 | $6,857 | $28,752 | $4,151 | $24,601 |
Source: Public Records
Map
Nearby Homes
- 4021 W Estes Ave
- 7230 N Keeler Ave
- 3924 W Greenleaf Ave
- 7225 N East Prairie Rd
- 3846 W Touhy Ave
- 3836 W Estes Ave
- 6936 N Keystone Ave
- 7226 N Kildare Ave
- 3832 W Chase Ave
- 7424 Crawford Ave
- 7412 Keeler Ave
- 3819 W Greenleaf Ave
- 7427 Tripp Ave
- 3814 W Sherwin Ave
- 7245 N Kostner Ave
- 7201 N Lincoln Ave Unit 308
- 7201 N Lincoln Ave Unit 301
- 7330 N Kilbourn Ave
- 4545 W Touhy Ave Unit 511
- 4545 W Touhy Ave Unit 420
- 7136 N Karlov Ave
- 7136 N Karlov Ave
- 7126 N Karlov Ave
- 7126 N Karlov Ave
- 7118 N Karlov Ave
- 7140 N Karlov Ave
- 7140 N Karlov Ave
- 7131 N Kedvale Ave
- 7127 N Kedvale Ave
- 7137 N Kedvale Ave
- 7141 N Kedvale Ave
- 7108 N Karlov Ave
- 7108 N Karlov Ave
- 7115 N Kedvale Ave
- 7145 N Kedvale Ave
- 7131 N Karlov Ave
- 7131 N Karlov Ave
- 7137 N Karlov Ave
- 7137 N Karlov Ave
- 7125 N Karlov Ave