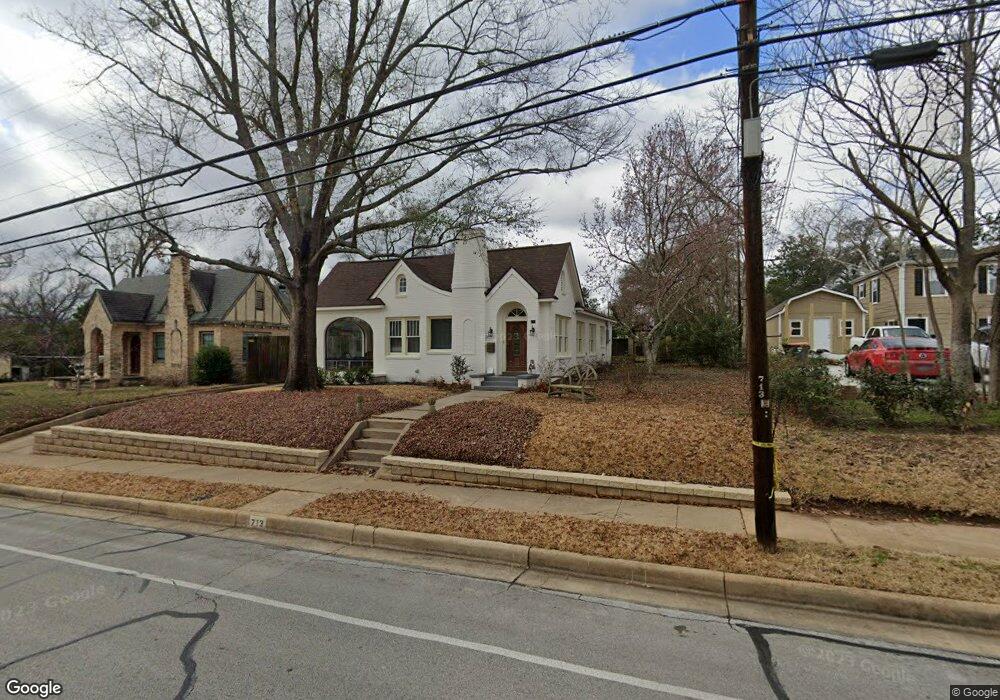
713 S Donnybrook Ave Tyler, TX 75701
Charnwood District NeighborhoodEstimated Value: $265,000 - $305,000
--
Bed
3
Baths
1,863
Sq Ft
$152/Sq Ft
Est. Value
About This Home
This home is located at 713 S Donnybrook Ave, Tyler, TX 75701 and is currently estimated at $283,607, approximately $152 per square foot. 713 S Donnybrook Ave is a home located in Smith County with nearby schools including Bell Elementary School, Hogg Middle School, and Tyler Legacy High School.
Ownership History
Date
Name
Owned For
Owner Type
Purchase Details
Closed on
Oct 18, 2018
Sold by
Owen Patrick J
Bought by
Miller David Charles and Miller Billie Kay
Current Estimated Value
Purchase Details
Closed on
Mar 22, 2016
Sold by
Bwana Properties Lp
Bought by
Owen Patrick J
Purchase Details
Closed on
Jul 2, 2013
Sold by
Vu Tuan A and Vu Roxanne M
Bought by
Bwana Properties Lp
Home Financials for this Owner
Home Financials are based on the most recent Mortgage that was taken out on this home.
Original Mortgage
$137,900
Interest Rate
3.63%
Mortgage Type
Balloon
Purchase Details
Closed on
Mar 16, 2012
Sold by
Mcaleer Stephanie
Bought by
Vu Tuan A and Vu Roxanne M
Home Financials for this Owner
Home Financials are based on the most recent Mortgage that was taken out on this home.
Original Mortgage
$105,500
Interest Rate
3.9%
Mortgage Type
New Conventional
Create a Home Valuation Report for This Property
The Home Valuation Report is an in-depth analysis detailing your home's value as well as a comparison with similar homes in the area
Home Values in the Area
Average Home Value in this Area
Purchase History
| Date | Buyer | Sale Price | Title Company |
|---|---|---|---|
| Miller David Charles | -- | None Available | |
| Owen Patrick J | -- | None Available | |
| Bwana Properties Lp | -- | Landmark Title | |
| Vu Tuan A | -- | None Available |
Source: Public Records
Mortgage History
| Date | Status | Borrower | Loan Amount |
|---|---|---|---|
| Previous Owner | Bwana Properties Lp | $137,900 | |
| Previous Owner | Vu Tuan A | $105,500 |
Source: Public Records
Tax History Compared to Growth
Tax History
| Year | Tax Paid | Tax Assessment Tax Assessment Total Assessment is a certain percentage of the fair market value that is determined by local assessors to be the total taxable value of land and additions on the property. | Land | Improvement |
|---|---|---|---|---|
| 2024 | $3,082 | $264,052 | $51,805 | $212,247 |
| 2023 | $4,251 | $243,873 | $51,805 | $192,068 |
| 2022 | $5,099 | $260,254 | $29,603 | $230,651 |
| 2021 | $3,692 | $175,988 | $29,603 | $146,385 |
| 2020 | $3,560 | $166,363 | $29,603 | $136,760 |
| 2019 | $3,418 | $156,316 | $29,603 | $126,713 |
| 2018 | $3,617 | $166,292 | $29,603 | $136,689 |
| 2017 | $3,550 | $166,292 | $29,603 | $136,689 |
| 2016 | $3,236 | $151,552 | $29,603 | $121,949 |
| 2015 | $2,968 | $146,468 | $29,695 | $116,773 |
| 2014 | $2,968 | $139,669 | $29,695 | $109,974 |
Source: Public Records
Map
Nearby Homes
- 735 S Donnybrook Ave
- 124 Rowland Place
- 128 Rowland Place
- 517 E Wells St
- 145 Rowland Place
- 201 W Rusk St
- 502 S Fannin Ave
- 300 E Dodge St
- 309 E Dodge St
- 310 W Dobbs St
- 520 E Lake St
- 428 S Bois d Arc Ave
- 815 S Chilton Ave
- 400 Lindsey Ln
- 841 S Chilton Ave
- 114 E 2nd St
- 1021 S Robertson Ave
- 513 W 1st St
- 705 S Vine Ave
- 1118 S Fleishel Ave
- 713 713 Donnybrook
- 713 713 S Donnybrook
- 727 S Donnybrook Ave
- 400 E Wells St
- 313 E Charnwood St
- 313 313 E Charnwood
- 716 S Donnybrook Ave
- 731 S Donnybrook Ave
- 712 712 Donnybrook Ave
- 718 718 Donnybrook Ave
- 718 Donnybrook Ave
- 307 E Wells St
- 706 S Donnybrook Ave
- 712 S Donnybrook Ave
- 702 S Donnybrook Ave
- 724 S Donnybrook Ave
- 225 E Wells St
- 223 E Charnwood St
- 401 E Charnwood St
- 730 S Donnybrook Ave