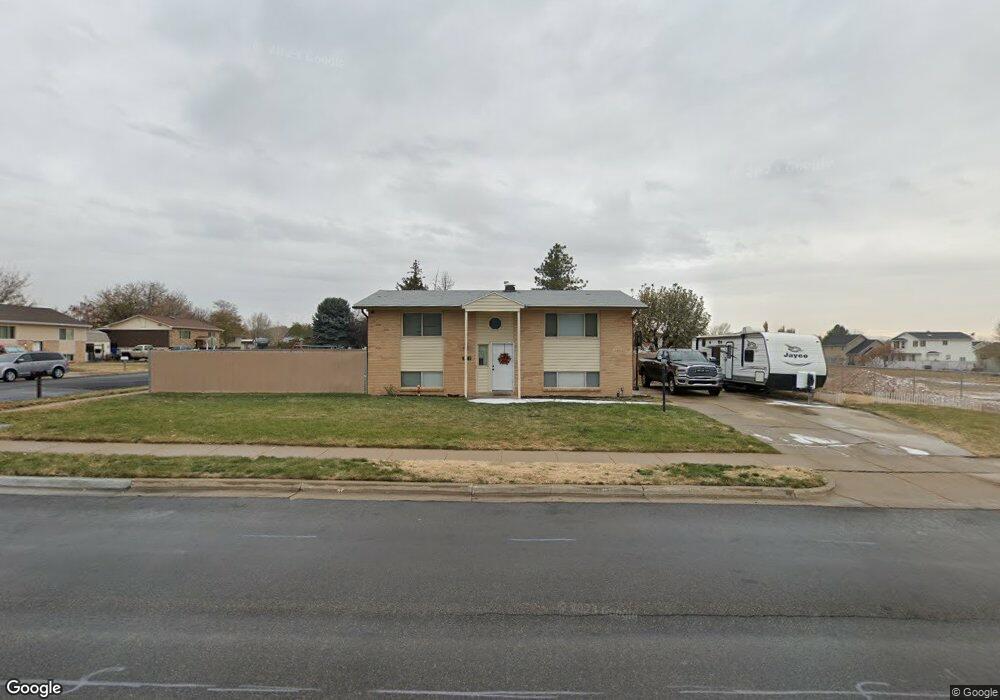
713 W 2200 N Clearfield, UT 84015
Estimated Value: $413,748 - $442,000
4
Beds
2
Baths
1,850
Sq Ft
$228/Sq Ft
Est. Value
About This Home
This home is located at 713 W 2200 N, Clearfield, UT 84015 and is currently estimated at $422,437, approximately $228 per square foot. 713 W 2200 N is a home located in Davis County with nearby schools including Fremont School, Sunset Junior High School, and Northridge High School.
Ownership History
Date
Name
Owned For
Owner Type
Purchase Details
Closed on
Feb 27, 2015
Sold by
Ogg Dustin D
Bought by
Ogg Dustin D and Ogg Amie M
Current Estimated Value
Purchase Details
Closed on
Dec 13, 2013
Sold by
Ogg Dustin D
Bought by
Ogg Dustin D and Ogg Amie M
Home Financials for this Owner
Home Financials are based on the most recent Mortgage that was taken out on this home.
Original Mortgage
$130,000
Interest Rate
4.04%
Mortgage Type
New Conventional
Purchase Details
Closed on
Oct 4, 2013
Sold by
Landreth Linda B
Bought by
Karras Nathan
Purchase Details
Closed on
Sep 12, 2013
Sold by
Wells Fargo Bank Na
Bought by
Karras Nathan
Create a Home Valuation Report for This Property
The Home Valuation Report is an in-depth analysis detailing your home's value as well as a comparison with similar homes in the area
Home Values in the Area
Average Home Value in this Area
Purchase History
| Date | Buyer | Sale Price | Title Company |
|---|---|---|---|
| Ogg Dustin D | -- | Founders Title | |
| Ogg Dustin D | -- | Founders Title | |
| Ogg Dustin D | -- | Mountain America Title | |
| Ogg Dustin D | -- | Mountain View Title | |
| Karras Nathan | -- | Title West Title Co | |
| Karras Nathan | -- | Title West Title Co |
Source: Public Records
Mortgage History
| Date | Status | Borrower | Loan Amount |
|---|---|---|---|
| Previous Owner | Ogg Dustin D | $130,000 |
Source: Public Records
Tax History Compared to Growth
Tax History
| Year | Tax Paid | Tax Assessment Tax Assessment Total Assessment is a certain percentage of the fair market value that is determined by local assessors to be the total taxable value of land and additions on the property. | Land | Improvement |
|---|---|---|---|---|
| 2025 | $2,031 | $195,250 | $81,777 | $113,473 |
| 2024 | $1,992 | $192,500 | $90,300 | $102,200 |
| 2023 | $1,823 | $326,000 | $102,022 | $223,978 |
| 2022 | $1,929 | $190,850 | $63,287 | $127,563 |
| 2021 | $1,758 | $258,000 | $77,742 | $180,258 |
| 2020 | $1,508 | $219,000 | $65,283 | $153,717 |
| 2019 | $1,466 | $208,000 | $77,732 | $130,268 |
| 2018 | $1,313 | $183,000 | $65,845 | $117,155 |
| 2016 | $1,119 | $80,575 | $25,476 | $55,099 |
| 2015 | $1,086 | $74,305 | $25,476 | $48,829 |
| 2014 | $1,019 | $70,829 | $25,476 | $45,353 |
| 2013 | -- | $71,975 | $22,606 | $49,369 |
Source: Public Records
Map
Nearby Homes