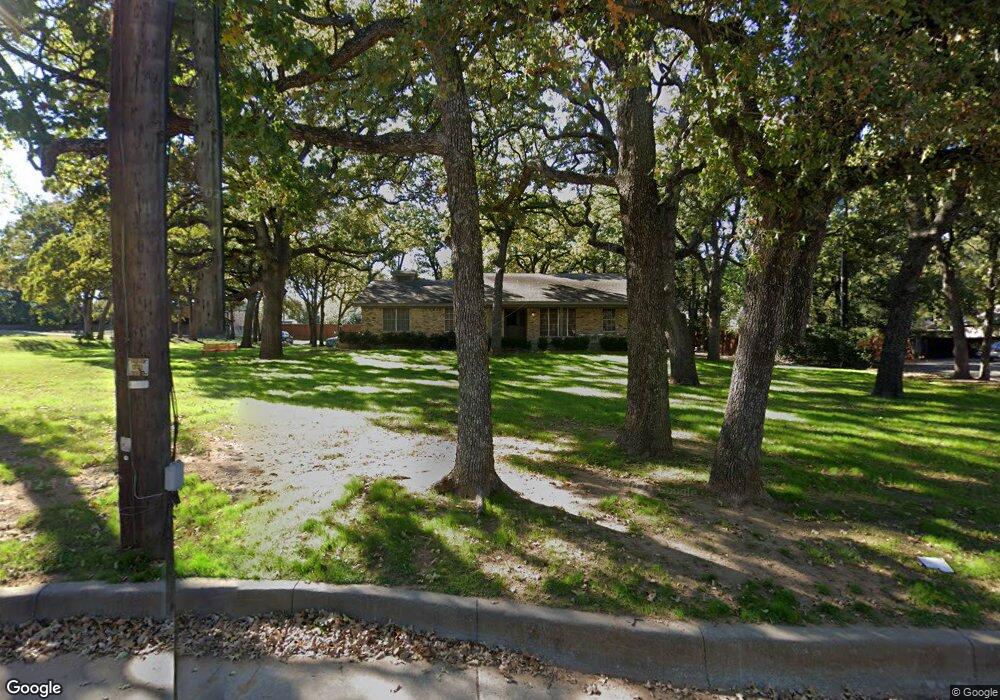
715 N Dove Rd Grapevine, TX 76051
Estimated Value: $729,000 - $807,000
4
Beds
4
Baths
3,078
Sq Ft
$249/Sq Ft
Est. Value
About This Home
This home is located at 715 N Dove Rd, Grapevine, TX 76051 and is currently estimated at $767,877, approximately $249 per square foot. 715 N Dove Rd is a home located in Tarrant County with nearby schools including Silver Lake Elementary School, Grapevine Middle, and Southlake Montessori.
Ownership History
Date
Name
Owned For
Owner Type
Purchase Details
Closed on
Aug 30, 2017
Sold by
Good Jean Y and Good Scott
Bought by
Winslow Christopher J and Winslow Melinda S
Current Estimated Value
Home Financials for this Owner
Home Financials are based on the most recent Mortgage that was taken out on this home.
Original Mortgage
$326,400
Outstanding Balance
$273,005
Interest Rate
3.96%
Mortgage Type
Stand Alone First
Estimated Equity
$494,872
Purchase Details
Closed on
Oct 14, 2003
Sold by
Cox Tawana Kay
Bought by
Good Jean Y
Home Financials for this Owner
Home Financials are based on the most recent Mortgage that was taken out on this home.
Original Mortgage
$178,880
Interest Rate
7.8%
Mortgage Type
Purchase Money Mortgage
Purchase Details
Closed on
Jan 19, 1995
Sold by
Cox Charles R
Bought by
Cox Tawana Kay
Purchase Details
Closed on
Dec 29, 1994
Sold by
Cox Charles Robert
Bought by
Cox Tawana Kay
Create a Home Valuation Report for This Property
The Home Valuation Report is an in-depth analysis detailing your home's value as well as a comparison with similar homes in the area
Home Values in the Area
Average Home Value in this Area
Purchase History
| Date | Buyer | Sale Price | Title Company |
|---|---|---|---|
| Winslow Christopher J | -- | None Available | |
| Good Jean Y | -- | -- | |
| Cox Tawana Kay | -- | -- | |
| Cox Tawana Kay | -- | -- |
Source: Public Records
Mortgage History
| Date | Status | Borrower | Loan Amount |
|---|---|---|---|
| Open | Winslow Christopher J | $326,400 | |
| Previous Owner | Good Jean Y | $178,880 |
Source: Public Records
Tax History Compared to Growth
Tax History
| Year | Tax Paid | Tax Assessment Tax Assessment Total Assessment is a certain percentage of the fair market value that is determined by local assessors to be the total taxable value of land and additions on the property. | Land | Improvement |
|---|---|---|---|---|
| 2025 | $2,354 | $563,000 | $255,282 | $307,718 |
| 2024 | $2,354 | $586,736 | $255,282 | $331,454 |
| 2023 | $8,812 | $679,169 | $194,062 | $485,107 |
| 2022 | $9,468 | $493,299 | $194,062 | $299,237 |
| 2021 | $9,446 | $470,000 | $207,000 | $263,000 |
| 2020 | $8,687 | $470,000 | $207,000 | $263,000 |
| 2019 | $8,188 | $470,000 | $207,000 | $263,000 |
| 2018 | $1,940 | $326,400 | $207,000 | $119,400 |
| 2017 | $7,632 | $470,792 | $207,000 | $263,792 |
| 2016 | $6,938 | $300,000 | $230,000 | $70,000 |
| 2015 | $5,990 | $277,800 | $100,000 | $177,800 |
| 2014 | $5,990 | $277,800 | $100,000 | $177,800 |
Source: Public Records
Map
Nearby Homes
- 1507 Country Forest Ct
- 1201 Circle View Ct
- 841 Meadow Bend Loop W
- 1002 Meadow Bend Loop N
- 1508 Bennington Ct
- 305 Tillery Cir
- 517 Yellowstone Dr
- 6007 Laurel Ln
- 6011 Laurel Ln
- 2081 Holt Way
- 2092 Holt Way
- 1916 Everglade Ct
- 1626 Choteau Cir
- 1323 Dublin St
- 1641 Choteau Cir
- 460 Caviness Dr
- 1092 Rosewood Dr
- 2140 S Winding Creek Dr
- 1654 Choteau Cir
- 218 W Peach St
- 721 N Dove Rd
- 718 N Dove Rd
- 702 N Dove Rd
- 1407 Tiffany Forest Ln
- 636 N Dove Rd
- 1401 Tiffany Forest Ln
- 1413 Tiffany Forest Ln
- 710 N Dove Rd
- 1419 Tiffany Forest Ln
- 1500 Thatcher Trail
- 732 N Dove Rd
- 1425 Tiffany Forest Ln
- 625 Turtledove Ln
- 612 N Dove Rd
- 1501 Tiffany Forest Ln
- 1507 Tiffany Forest Ln
- 802 Lake Forest Ct
- 1408 Tiffany Forest Ln
- 1402 Tiffany Forest Ln
- 621 Turtledove Ln