716-720 Main St Brewster, MA 2631
--
Bed
--
Bath
3,558
Sq Ft
1
Acres
About This Home
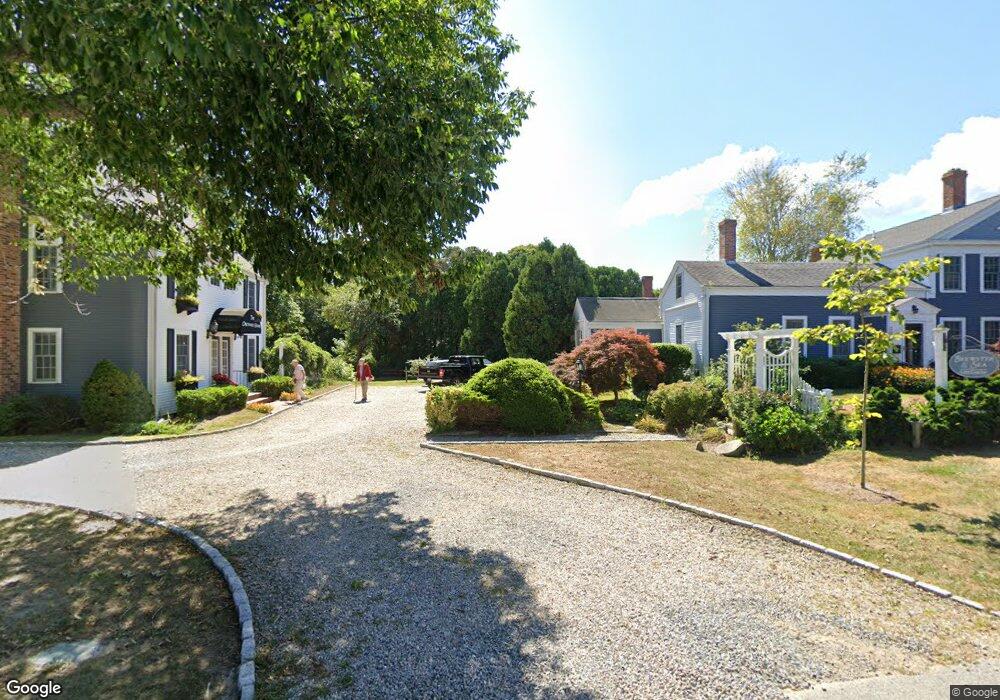
This home is located at 716-720 Main St, Brewster, MA 2631. 716-720 Main St is a home located in Barnstable County with nearby schools including Stony Brook Elementary School, Eddy Elementary School, and Nauset Regional Middle School.
Ownership History
Date
Name
Owned For
Owner Type
Purchase Details
Closed on
Nov 9, 2016
Sold by
Wind Reef Inc
Bought by
Oor Hame Llc
Home Financials for this Owner
Home Financials are based on the most recent Mortgage that was taken out on this home.
Original Mortgage
$1,000,000
Outstanding Balance
$802,827
Interest Rate
3.42%
Mortgage Type
Commercial
Purchase Details
Closed on
Jun 24, 1996
Sold by
Messina Robert P and Zelich Joseph R
Bought by
Concors Gary J and Concors Carol A
Purchase Details
Closed on
May 28, 1992
Sold by
Shultz David C
Bought by
Drp Corp
Purchase Details
Closed on
Sep 24, 1987
Sold by
Thomason Barbara
Bought by
Schultz David C
Create a Home Valuation Report for This Property
The Home Valuation Report is an in-depth analysis detailing your home's value as well as a comparison with similar homes in the area
Home Values in the Area
Average Home Value in this Area
Purchase History
| Date | Buyer | Sale Price | Title Company |
|---|---|---|---|
| Oor Hame Llc | $945,000 | -- | |
| Concors Gary J | $450,000 | -- | |
| Concors Gary J | $450,000 | -- | |
| Drp Corp | $225,000 | -- | |
| Drp Corp | $225,000 | -- | |
| Schultz David C | $500,000 | -- |
Source: Public Records
Mortgage History
| Date | Status | Borrower | Loan Amount |
|---|---|---|---|
| Open | Oor Hame Llc | $1,000,000 | |
| Closed | Schultz David C | $1,000,000 | |
| Previous Owner | Schultz David C | $1,662,000 |
Source: Public Records
Tax History Compared to Growth
Tax History
| Year | Tax Paid | Tax Assessment Tax Assessment Total Assessment is a certain percentage of the fair market value that is determined by local assessors to be the total taxable value of land and additions on the property. | Land | Improvement |
|---|---|---|---|---|
| 2025 | $12,019 | $1,747,000 | $252,600 | $1,494,400 |
| 2024 | $11,315 | $1,661,500 | $242,900 | $1,418,600 |
| 2023 | $10,763 | $1,539,700 | $222,000 | $1,317,700 |
| 2022 | $10,132 | $1,290,700 | $193,200 | $1,097,500 |
| 2021 | $10,409 | $1,213,200 | $193,200 | $1,020,000 |
| 2020 | $10,166 | $1,179,300 | $193,200 | $986,100 |
| 2019 | $9,934 | $1,157,800 | $193,200 | $964,600 |
| 2018 | $9,293 | $1,125,000 | $193,200 | $931,800 |
| 2017 | $8,787 | $1,047,300 | $193,200 | $854,100 |
| 2016 | $8,664 | $1,027,800 | $189,600 | $838,200 |
| 2015 | $8,338 | $1,009,400 | $185,900 | $823,500 |
Source: Public Records
Map
Nearby Homes