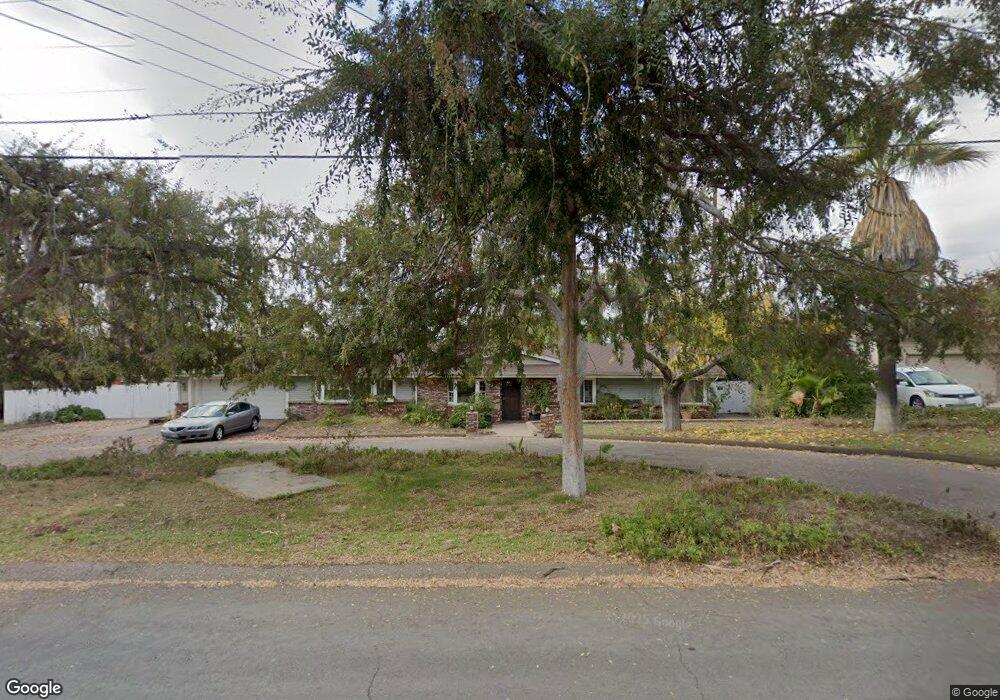
716 El Rancho Dr El Cajon, CA 92019
Granite Hills NeighborhoodEstimated Value: $1,102,000 - $1,191,384
4
Beds
3
Baths
2,343
Sq Ft
$495/Sq Ft
Est. Value
About This Home
This home is located at 716 El Rancho Dr, El Cajon, CA 92019 and is currently estimated at $1,160,096, approximately $495 per square foot. 716 El Rancho Dr is a home located in San Diego County with nearby schools including Madison Avenue Elementary School, Montgomery Middle School, and Granite Hills High School.
Ownership History
Date
Name
Owned For
Owner Type
Purchase Details
Closed on
Mar 17, 2011
Sold by
Wood Ronald Pleasant and Wood Annette Lorain
Bought by
Harpster Matthew F and Smith Suzanne L
Current Estimated Value
Home Financials for this Owner
Home Financials are based on the most recent Mortgage that was taken out on this home.
Original Mortgage
$325,000
Outstanding Balance
$225,087
Interest Rate
4.96%
Mortgage Type
New Conventional
Estimated Equity
$935,009
Purchase Details
Closed on
Dec 29, 2009
Sold by
Wood Ronald P and Wood Annette L
Bought by
Wood Ronald Pleasant and Wood Annette Lorain
Purchase Details
Closed on
Jul 19, 2004
Sold by
Perry Linda J
Bought by
Wood Ronald P and Wood Annette L
Home Financials for this Owner
Home Financials are based on the most recent Mortgage that was taken out on this home.
Original Mortgage
$584,000
Interest Rate
1.25%
Mortgage Type
Negative Amortization
Purchase Details
Closed on
Nov 9, 1994
Sold by
Perry Steven A and Perry Linda J
Bought by
Perry Linda J
Purchase Details
Closed on
Sep 30, 1988
Create a Home Valuation Report for This Property
The Home Valuation Report is an in-depth analysis detailing your home's value as well as a comparison with similar homes in the area
Home Values in the Area
Average Home Value in this Area
Purchase History
| Date | Buyer | Sale Price | Title Company |
|---|---|---|---|
| Harpster Matthew F | $438,000 | Fidelity National Title | |
| Wood Ronald Pleasant | -- | None Available | |
| Wood Ronald P | $730,000 | Southland Title Of San Diego | |
| Perry Linda J | -- | -- | |
| -- | $225,000 | -- |
Source: Public Records
Mortgage History
| Date | Status | Borrower | Loan Amount |
|---|---|---|---|
| Open | Harpster Matthew F | $325,000 | |
| Previous Owner | Wood Ronald P | $584,000 |
Source: Public Records
Tax History Compared to Growth
Tax History
| Year | Tax Paid | Tax Assessment Tax Assessment Total Assessment is a certain percentage of the fair market value that is determined by local assessors to be the total taxable value of land and additions on the property. | Land | Improvement |
|---|---|---|---|---|
| 2025 | $6,572 | $561,140 | $243,416 | $317,724 |
| 2024 | $6,572 | $550,139 | $238,644 | $311,495 |
| 2023 | $6,400 | $539,353 | $233,965 | $305,388 |
| 2022 | $6,299 | $528,778 | $229,378 | $299,400 |
| 2021 | $6,211 | $518,411 | $224,881 | $293,530 |
| 2020 | $6,143 | $513,097 | $222,576 | $290,521 |
| 2019 | $6,064 | $503,037 | $218,212 | $284,825 |
| 2018 | $5,964 | $493,175 | $213,934 | $279,241 |
| 2017 | $592 | $483,506 | $209,740 | $273,766 |
| 2016 | $5,650 | $474,027 | $205,628 | $268,399 |
| 2015 | $5,621 | $466,908 | $202,540 | $264,368 |
| 2014 | $5,510 | $457,763 | $198,573 | $259,190 |
Source: Public Records
Map
Nearby Homes
- 1870 Euclid Ave Unit 1870
- 1319 Yannis Ct
- 603 Galena St
- 0 Vista Valley Rim Place Unit 180055692
- 1885 Euclid Ave
- 1170 Via Loma Vista
- 1138 Via Loma Vista
- 1952 Euclid Ave
- 2044 Eula Ln
- 1935 Granite Hills Dr
- 2155 Vista Valley Rim Place
- 648 Trenton St Unit 5
- 1772 Greenfield Ct
- 2103 Sunnyside Ave
- 1755 E Lexington Ave
- 1961 Forester Creek Rd
- 330 Vista Del Escuela
- 2202 Via Verde
- 2060 Forester Creek Rd
- 0 Quicker Rd Unit 250029645
- 740 El Rancho Dr
- 704 El Rancho Dr
- 750 El Rancho Dr
- 703 El Rancho Dr
- 662 El Rancho Dr
- 719 El Rancho Dr
- 754 El Rancho Dr
- 663 El Rancho Dr
- 733 El Rancho Dr
- 745 El Rancho Dr
- 646 El Rancho Dr
- 766 El Rancho Dr
- 645 El Rancho Dr
- 1803 Naranca Ave
- 757 El Rancho Dr
- 638 El Rancho Dr
- 1805 Naranca Ave
- 1911 Naranca Ave
- 633 El Rancho Dr
- 717 Waimea Dr