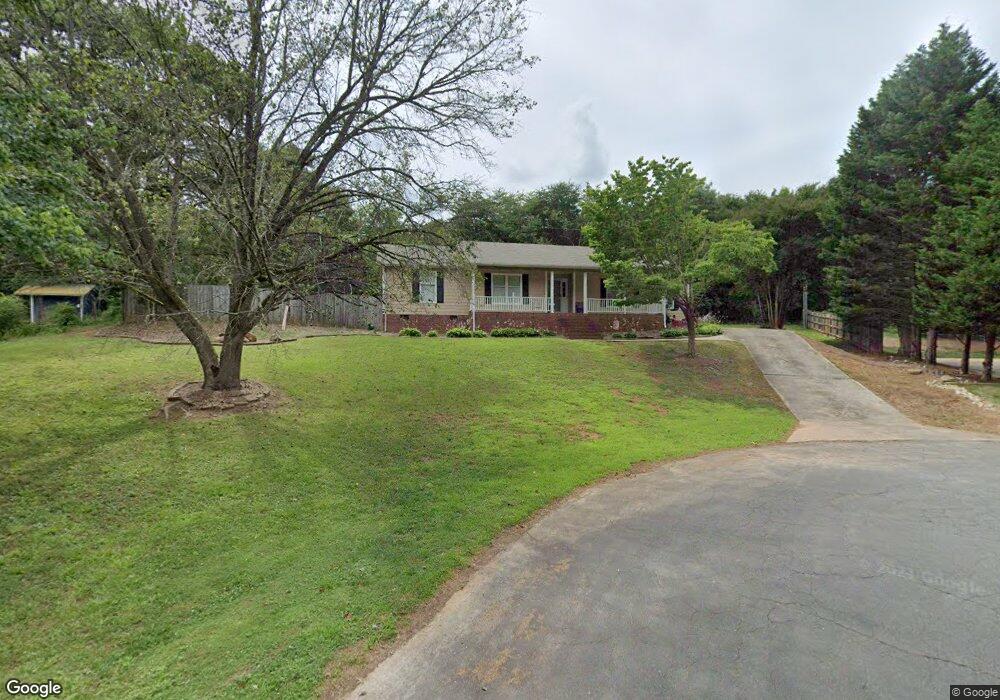
716 Lampwick Ct Gastonia, NC 28056
Estimated Value: $291,000 - $319,085
3
Beds
2
Baths
1,567
Sq Ft
$195/Sq Ft
Est. Value
About This Home
This home is located at 716 Lampwick Ct, Gastonia, NC 28056 and is currently estimated at $305,271, approximately $194 per square foot. 716 Lampwick Ct is a home located in Gaston County with nearby schools including W.A. Bess Elementary School, Cramerton Middle School, and Forestview High School.
Ownership History
Date
Name
Owned For
Owner Type
Purchase Details
Closed on
Dec 13, 2021
Sold by
Johnson Nichole M
Bought by
Johnson Nichole M
Current Estimated Value
Home Financials for this Owner
Home Financials are based on the most recent Mortgage that was taken out on this home.
Original Mortgage
$80,995
Outstanding Balance
$69,239
Interest Rate
2.98%
Mortgage Type
New Conventional
Estimated Equity
$236,032
Purchase Details
Closed on
Apr 26, 2002
Sold by
Eiden James F and Eiden Denise J
Bought by
Johnson Nichole M
Home Financials for this Owner
Home Financials are based on the most recent Mortgage that was taken out on this home.
Original Mortgage
$107,350
Interest Rate
7.07%
Purchase Details
Closed on
Oct 10, 2000
Sold by
Kyle Jackie Bill and Kyle Christy Deal
Bought by
Eiden James F and Eiden Denise J
Home Financials for this Owner
Home Financials are based on the most recent Mortgage that was taken out on this home.
Original Mortgage
$113,050
Interest Rate
7.96%
Create a Home Valuation Report for This Property
The Home Valuation Report is an in-depth analysis detailing your home's value as well as a comparison with similar homes in the area
Home Values in the Area
Average Home Value in this Area
Purchase History
| Date | Buyer | Sale Price | Title Company |
|---|---|---|---|
| Johnson Nichole M | -- | None Listed On Document | |
| Johnson Nichole M | $113,000 | -- | |
| Eiden James F | $119,000 | -- |
Source: Public Records
Mortgage History
| Date | Status | Borrower | Loan Amount |
|---|---|---|---|
| Open | Johnson Nichole M | $80,995 | |
| Previous Owner | Johnson Nichole M | $107,350 | |
| Previous Owner | Eiden James F | $113,050 |
Source: Public Records
Tax History Compared to Growth
Tax History
| Year | Tax Paid | Tax Assessment Tax Assessment Total Assessment is a certain percentage of the fair market value that is determined by local assessors to be the total taxable value of land and additions on the property. | Land | Improvement |
|---|---|---|---|---|
| 2025 | $2,178 | $305,060 | $22,000 | $283,060 |
| 2024 | $2,178 | $305,060 | $22,000 | $283,060 |
| 2023 | $2,120 | $305,060 | $22,000 | $283,060 |
| 2022 | $1,341 | $145,780 | $18,000 | $127,780 |
| 2021 | $1,321 | $145,780 | $18,000 | $127,780 |
| 2019 | $1,319 | $145,780 | $18,000 | $127,780 |
| 2018 | $1,406 | $148,493 | $18,000 | $130,493 |
| 2017 | $1,406 | $148,493 | $18,000 | $130,493 |
| 2016 | $1,406 | $148,493 | $0 | $0 |
| 2014 | $1,274 | $135,985 | $22,500 | $113,485 |
Source: Public Records
Map
Nearby Homes
- 809 Briarcliff Rd
- 348 Zocalo Dr
- 725 Rosegate Dr
- 741 Climbing Rose Ct
- 3717 English Garden Dr
- 3572 Heather Ln
- 854 Longford Dr
- 824 Wingthorn Rose Dr
- 848 Wingthorn Rose Dr
- 515 Lakewood Dr
- 734 Forestbrook Dr
- 3441 Club Ridge Ct
- 3472 Club Ridge Ct
- 911 Weymouth Dr
- * Spanish Oak Ln Unit Lots 34, 35
- * Spanish Oak Ln Unit Lot 7
- 3313 Pineridge Ln
- * Eagles Walk Unit Lots 36 & 40
- 530 Wilmot Trail
- 3173 Yosemite Dr
- 712 Lampwick Ct
- 717 Lampwick Ct
- 708 Lampwick Ct
- 709 Lampwick Ct
- 704 Lampwick Ct
- 705 Lampwick Ct
- 701 Lampwick Ct
- 700 Lampwick Ct
- 681 Ole Lamp Ln
- 685 Ole Lamp Ln
- 689 Ole Lamp Ln
- 693 Ole Lamp Ln
- 711 Woodhaven Ln
- 3922 Robinson Cir
- 3922 Robinson Cir Unit 2 & 3
- 667 Ole Lamp Ln
- 709 Woodhaven Ln
- 3830 Springway Dr
- 678 Ole Lamp Ln
- 686 Ole Lamp Ln