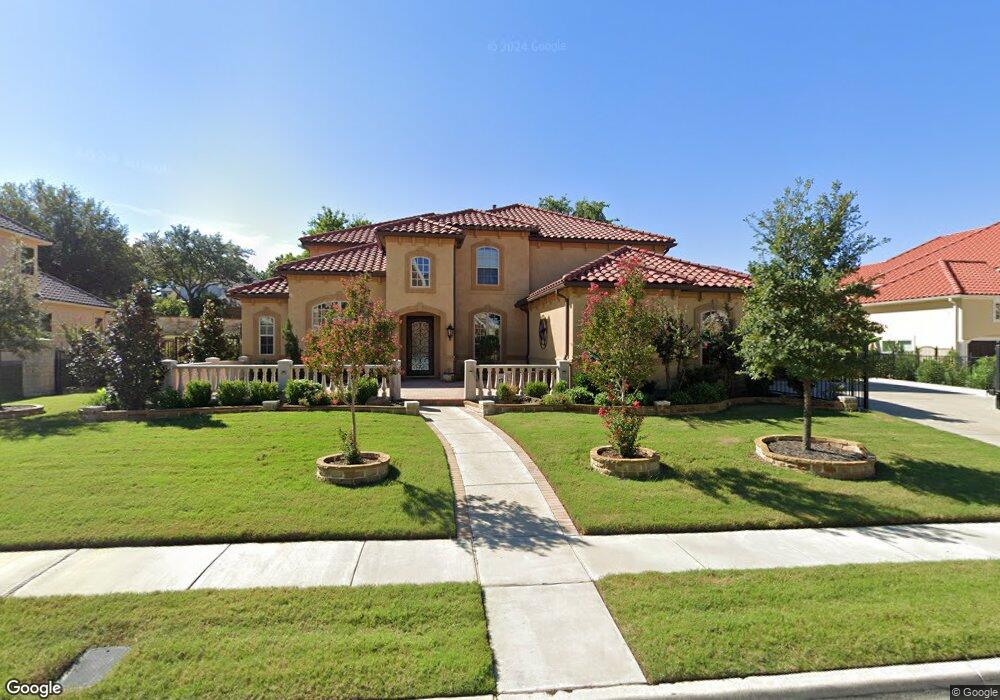
717 Glen Abbey Dr South Lake, TX 76092
Estimated Value: $1,246,000 - $2,038,000
4
Beds
5
Baths
4,675
Sq Ft
$334/Sq Ft
Est. Value
About This Home
This home is located at 717 Glen Abbey Dr, South Lake, TX 76092 and is currently estimated at $1,563,589, approximately $334 per square foot. 717 Glen Abbey Dr is a home located in Tarrant County with nearby schools including Don T. Durham Intermediate School, Walnut Grove Elementary School, and Carroll Middle School.
Ownership History
Date
Name
Owned For
Owner Type
Purchase Details
Closed on
Jun 12, 2019
Sold by
Sesi Yerubandi Venkata and Sesi Odury
Bought by
Gandi Gouri S and Katakam Lavanya
Current Estimated Value
Home Financials for this Owner
Home Financials are based on the most recent Mortgage that was taken out on this home.
Original Mortgage
$725,000
Outstanding Balance
$637,452
Interest Rate
4.1%
Mortgage Type
New Conventional
Estimated Equity
$926,137
Purchase Details
Closed on
Jan 21, 2015
Sold by
Toll Dalls Tx Llc
Bought by
Sesi Yerubandi Venkata and Sesi Odury
Home Financials for this Owner
Home Financials are based on the most recent Mortgage that was taken out on this home.
Original Mortgage
$707,312
Interest Rate
3%
Mortgage Type
Adjustable Rate Mortgage/ARM
Create a Home Valuation Report for This Property
The Home Valuation Report is an in-depth analysis detailing your home's value as well as a comparison with similar homes in the area
Home Values in the Area
Average Home Value in this Area
Purchase History
| Date | Buyer | Sale Price | Title Company |
|---|---|---|---|
| Gandi Gouri S | -- | Freedom Title | |
| Sesi Yerubandi Venkata | -- | None Available |
Source: Public Records
Mortgage History
| Date | Status | Borrower | Loan Amount |
|---|---|---|---|
| Open | Gandi Gouri S | $725,000 | |
| Previous Owner | Sesi Yerubandi Venkata | $707,312 |
Source: Public Records
Tax History Compared to Growth
Tax History
| Year | Tax Paid | Tax Assessment Tax Assessment Total Assessment is a certain percentage of the fair market value that is determined by local assessors to be the total taxable value of land and additions on the property. | Land | Improvement |
|---|---|---|---|---|
| 2025 | $18,877 | $1,037,300 | $275,000 | $762,300 |
| 2024 | $18,877 | $1,230,015 | $275,000 | $955,015 |
| 2023 | $19,036 | $1,344,500 | $275,000 | $1,069,500 |
| 2022 | $22,864 | $1,112,000 | $250,000 | $862,000 |
| 2021 | $21,967 | $963,459 | $250,000 | $713,459 |
| 2020 | $22,370 | $973,181 | $250,000 | $723,181 |
| 2019 | $22,758 | $939,836 | $250,000 | $689,836 |
| 2018 | $21,234 | $925,311 | $250,000 | $675,311 |
| 2017 | $23,244 | $937,775 | $250,000 | $687,775 |
| 2016 | $24,679 | $995,676 | $300,000 | $695,676 |
| 2015 | -- | $837,803 | $300,000 | $537,803 |
Source: Public Records
Map
Nearby Homes
- 912 Berkshire Rd
- 812 Lexington Terrace
- 408 W Chapel Downs Dr
- 403 Presidio Ct
- 914 Turnberry Ln
- 1403 Lands End Ct
- 300 Shady Oaks Dr
- 1275 Shady Oaks Dr
- 1285 Shady Oaks Dr
- 1101 Linnea Ln
- 320 W Highland St
- 102 Springbrook Ct
- 1402 Thetford Ct
- 1425 N Peytonville Ave
- 1213 Rothschild Blvd
- 550 N Peytonville Ave
- 106 Ascot Dr
- 1210 Wood Creek Ln
- 204 Southridge Lakes Pkwy
- 711 Saratoga Dr
- 801 Glen Abbey Dr
- 713 Glen Abbey Dr
- 608 Loving Ct
- 606 Loving Ct
- 716 Glen Abbey Dr
- 610 Loving Ct
- 800 Glen Abbey Dr
- 712 Glen Abbey Dr
- 805 Glen Abbey Dr
- 804 Glen Abbey Dr
- 604 Loving Ct
- 612 Loving Ct
- 708 Glen Abbey Dr
- 717 Helmsley Place
- 801 Helmsley Place
- 713 Helmsley Place
- 808 Glen Abbey Dr
- 809 Glen Abbey Dr
- 805 Helmsley Place
- 607 Loving Ct