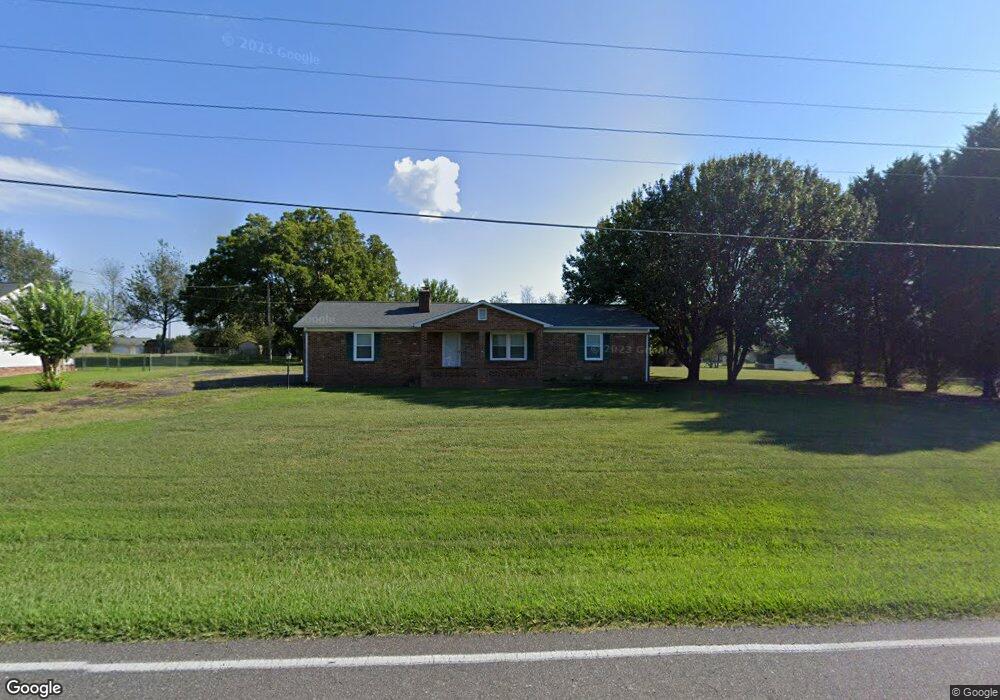
719 Bethlehem Church Rd Kings Mountain, NC 28086
Estimated Value: $229,784 - $299,000
--
Bed
--
Bath
1,230
Sq Ft
$219/Sq Ft
Est. Value
About This Home
This home is located at 719 Bethlehem Church Rd, Kings Mountain, NC 28086 and is currently estimated at $269,946, approximately $219 per square foot. 719 Bethlehem Church Rd is a home located in Cleveland County with nearby schools including Bethware Elementary School, Kings Mountain Middle, and Kings Mountain Intermediate School.
Ownership History
Date
Name
Owned For
Owner Type
Purchase Details
Closed on
Jun 23, 2021
Sold by
Phillips Paul Richard and Phillips Brenda Joyce
Bought by
Phillips Paul Richard and Phillips Brenda Joyce
Current Estimated Value
Purchase Details
Closed on
Nov 1, 2007
Sold by
Holder Angela and Holder Grant
Bought by
Phillips Paul R and Phillips Brenda H
Home Financials for this Owner
Home Financials are based on the most recent Mortgage that was taken out on this home.
Original Mortgage
$103,500
Outstanding Balance
$65,113
Interest Rate
6.27%
Mortgage Type
New Conventional
Estimated Equity
$204,833
Purchase Details
Closed on
Oct 31, 2007
Sold by
Hamrick Lawrecnce and Hamrick Sybil Blalock
Bought by
Phillips Raul R and Phillips Brenda H
Home Financials for this Owner
Home Financials are based on the most recent Mortgage that was taken out on this home.
Original Mortgage
$103,500
Outstanding Balance
$65,113
Interest Rate
6.27%
Mortgage Type
New Conventional
Estimated Equity
$204,833
Create a Home Valuation Report for This Property
The Home Valuation Report is an in-depth analysis detailing your home's value as well as a comparison with similar homes in the area
Home Values in the Area
Average Home Value in this Area
Purchase History
| Date | Buyer | Sale Price | Title Company |
|---|---|---|---|
| Phillips Paul Richard | -- | None Available | |
| Phillips Paul R | $115,000 | None Available | |
| Phillips Raul R | -- | None Available |
Source: Public Records
Mortgage History
| Date | Status | Borrower | Loan Amount |
|---|---|---|---|
| Open | Phillips Paul R | $103,500 |
Source: Public Records
Tax History Compared to Growth
Tax History
| Year | Tax Paid | Tax Assessment Tax Assessment Total Assessment is a certain percentage of the fair market value that is determined by local assessors to be the total taxable value of land and additions on the property. | Land | Improvement |
|---|---|---|---|---|
| 2025 | $1,281 | $201,700 | $34,149 | $167,551 |
| 2024 | $1,273 | $150,011 | $28,458 | $121,553 |
| 2023 | $1,267 | $150,011 | $28,458 | $121,553 |
| 2022 | $1,267 | $150,011 | $28,458 | $121,553 |
| 2021 | $1,271 | $150,011 | $28,458 | $121,553 |
| 2020 | $1,073 | $120,808 | $26,560 | $94,248 |
| 2019 | $1,073 | $120,808 | $26,560 | $94,248 |
| 2018 | $1,069 | $120,808 | $26,560 | $94,248 |
| 2017 | $1,064 | $120,808 | $26,560 | $94,248 |
| 2016 | $1,016 | $120,808 | $26,560 | $94,248 |
| 2015 | $923 | $108,954 | $13,280 | $95,674 |
| 2014 | $923 | $108,954 | $13,280 | $95,674 |
Source: Public Records
Map
Nearby Homes
- 707 Sandalwood Ln
- 716 Mcdaniel Rd
- 907 Bethlehem Rd
- 813 Bethlehem Rd
- 802 Bethlehem Rd Unit 5
- 000 Bethlehem Rd
- 215 Chadwick Dr
- 411 El Bethel Rd
- 131 Sam Smith Dr
- 400 El Bethel Rd
- 107 Tara Terrace
- 310 Yarbro Rd
- 1425 Bethlehem Rd
- 143 Yarbro Rd Unit 2
- 107 Connor Ct
- 507 Bethlehem Rd
- 132 Yarbro Rd Unit 17
- 132 Yarbro Rd Unit 13
- 114 Yarbro Rd Unit 23
- 2167 Vestibule Church Rd Unit 5U, 16U
- 717 Bethlehem Church Rd
- 717 Bethlehem Rd
- 721 Bethlehem Church Rd
- 715 Bethlehem Church Rd Unit 25
- 715 Bethlehem Rd
- 118 Trotter Ln
- 122 Trotter Ln
- 116 Trotter Ln
- 718 Bethlehem Church Rd
- 716 Bethlehem Church Rd
- 713 Bethlehem Church Rd
- 124 Trotter Ln
- 727 Bethlehem Church Rd
- 109 Huntseat Dr
- 112 Trotter Ln
- 106 Trotter Ln
- 724 Bethlehem Church Rd
- 113 Huntseat Dr
- 123 Trotter Ln
- 710 Bethlehem Church Rd