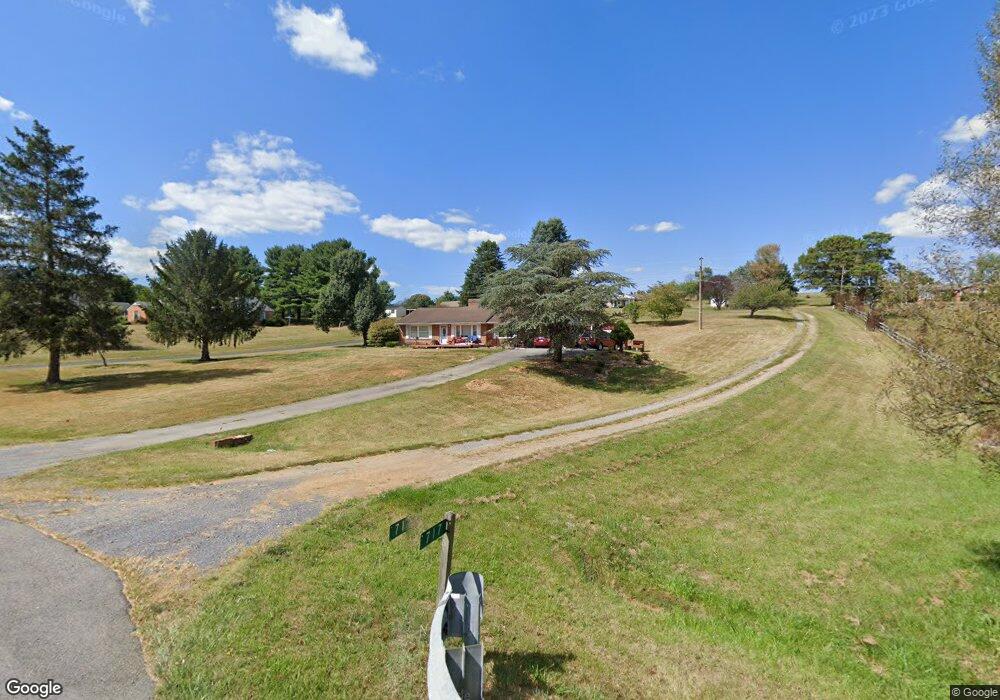
719 Middlebrook Rd Staunton, VA 24401
Estimated Value: $211,000 - $295,000
3
Beds
1
Bath
1,628
Sq Ft
$165/Sq Ft
Est. Value
About This Home
This home is located at 719 Middlebrook Rd, Staunton, VA 24401 and is currently estimated at $268,708, approximately $165 per square foot. 719 Middlebrook Rd is a home located in Augusta County with nearby schools including Beverley Manor Elementary School, Riverheads Elementary School, and Beverley Manor Middle School.
Ownership History
Date
Name
Owned For
Owner Type
Purchase Details
Closed on
Oct 30, 2008
Sold by
Wood Micahel Kyle
Bought by
Chambers Erik W
Current Estimated Value
Home Financials for this Owner
Home Financials are based on the most recent Mortgage that was taken out on this home.
Original Mortgage
$145,200
Outstanding Balance
$95,501
Interest Rate
6.12%
Mortgage Type
New Conventional
Estimated Equity
$173,207
Purchase Details
Closed on
Apr 27, 2005
Sold by
Galford Ileen L and Swisher Ileen L
Bought by
Wood Michael Kyle
Home Financials for this Owner
Home Financials are based on the most recent Mortgage that was taken out on this home.
Original Mortgage
$168,198
Interest Rate
5.95%
Mortgage Type
New Conventional
Create a Home Valuation Report for This Property
The Home Valuation Report is an in-depth analysis detailing your home's value as well as a comparison with similar homes in the area
Home Values in the Area
Average Home Value in this Area
Purchase History
| Date | Buyer | Sale Price | Title Company |
|---|---|---|---|
| Chambers Erik W | -- | -- | |
| Wood Michael Kyle | -- | -- |
Source: Public Records
Mortgage History
| Date | Status | Borrower | Loan Amount |
|---|---|---|---|
| Open | Chambers Erik W | $145,200 | |
| Previous Owner | Wood Michael Kyle | $168,198 |
Source: Public Records
Tax History Compared to Growth
Tax History
| Year | Tax Paid | Tax Assessment Tax Assessment Total Assessment is a certain percentage of the fair market value that is determined by local assessors to be the total taxable value of land and additions on the property. | Land | Improvement |
|---|---|---|---|---|
| 2025 | $1,185 | $227,900 | $55,000 | $172,900 |
| 2024 | $1,185 | $227,900 | $55,000 | $172,900 |
| 2023 | $1,041 | $165,300 | $45,000 | $120,300 |
| 2022 | $1,041 | $165,300 | $45,000 | $120,300 |
| 2021 | $1,041 | $165,300 | $45,000 | $120,300 |
| 2020 | $1,041 | $165,300 | $45,000 | $120,300 |
| 2019 | $1,039 | $165,300 | $45,000 | $120,300 |
| 2018 | $1,034 | $164,249 | $45,000 | $119,249 |
| 2017 | $952 | $164,249 | $45,000 | $119,249 |
| 2016 | $952 | $164,249 | $45,000 | $119,249 |
| 2015 | $855 | $164,249 | $45,000 | $119,249 |
| 2014 | $855 | $164,249 | $45,000 | $119,249 |
| 2013 | $855 | $178,200 | $55,000 | $123,200 |
Source: Public Records
Map
Nearby Homes
- 737 Middlebrook Rd
- 739 Middlebrook Rd
- 736 Middlebrook Rd
- 745 Middlebrook Rd
- 43 Apple Jack Ln
- 712 Middlebrook Rd
- 712 Middlebrook Rd
- 753 Middlebrook Rd
- 717 Middlebrook Rd
- 742 Middlebrook Rd
- 746 Middlebrook Rd
- 757 Middlebrook Rd
- 48 Apple Jack Ln
- 684 Middlebrook Rd
- 767 Middlebrook Rd
- 762 Middlebrook Rd
- 40 Stingy Hollow Rd
- 764 Middlebrook Rd
- 76 Apple Jack Ln
- 769 Middlebrook Rd