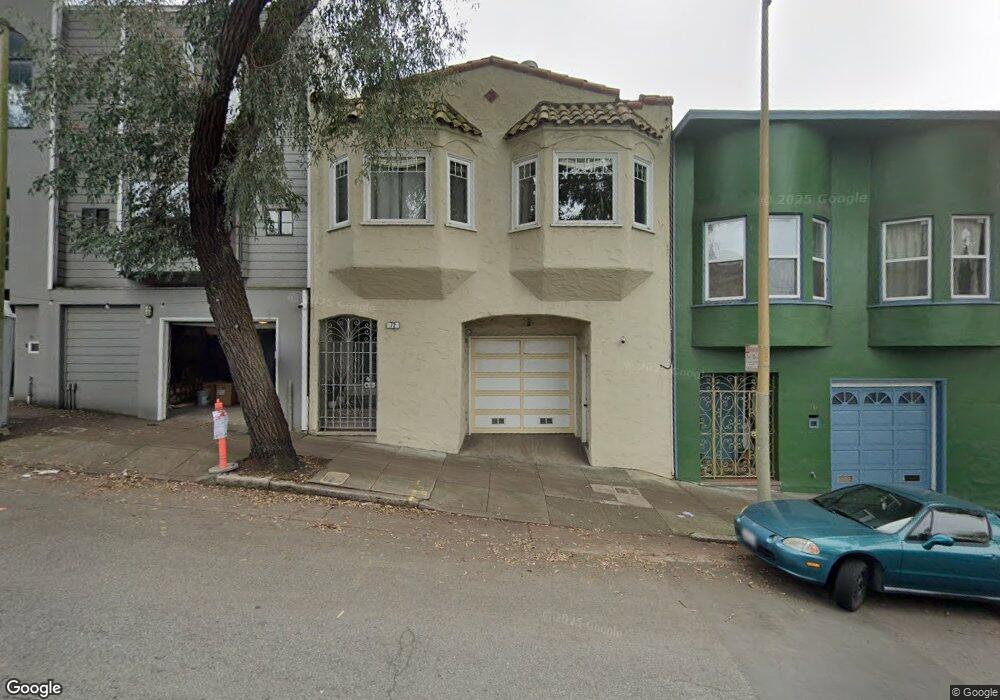
72 Cortland Ave San Francisco, CA 94110
Bernal Heights NeighborhoodEstimated Value: $1,064,000 - $1,534,000
2
Beds
1
Bath
1,000
Sq Ft
$1,246/Sq Ft
Est. Value
About This Home
This home is located at 72 Cortland Ave, San Francisco, CA 94110 and is currently estimated at $1,246,015, approximately $1,246 per square foot. 72 Cortland Ave is a home located in San Francisco County with nearby schools including Serra (Junipero) Elementary School, Hoover (Herbert) Middle School, and Donum Dei Classical Academy.
Ownership History
Date
Name
Owned For
Owner Type
Purchase Details
Closed on
Nov 19, 2004
Sold by
Baca Ramon and Baca Marisa
Bought by
Holland Shane and Holland Victoria
Current Estimated Value
Home Financials for this Owner
Home Financials are based on the most recent Mortgage that was taken out on this home.
Original Mortgage
$588,800
Outstanding Balance
$290,693
Interest Rate
5.62%
Mortgage Type
New Conventional
Estimated Equity
$955,322
Purchase Details
Closed on
May 22, 2000
Sold by
Ramon Baca and Gilda Marisa
Bought by
Baca Ramon and Baca Marisa
Home Financials for this Owner
Home Financials are based on the most recent Mortgage that was taken out on this home.
Original Mortgage
$50,000
Interest Rate
7.84%
Create a Home Valuation Report for This Property
The Home Valuation Report is an in-depth analysis detailing your home's value as well as a comparison with similar homes in the area
Home Values in the Area
Average Home Value in this Area
Purchase History
| Date | Buyer | Sale Price | Title Company |
|---|---|---|---|
| Holland Shane | $736,000 | First American Title Company | |
| Baca Ramon | -- | Fidelity National Title Co |
Source: Public Records
Mortgage History
| Date | Status | Borrower | Loan Amount |
|---|---|---|---|
| Open | Holland Shane | $588,800 | |
| Previous Owner | Baca Ramon | $50,000 | |
| Closed | Holland Shane | $110,400 |
Source: Public Records
Tax History Compared to Growth
Tax History
| Year | Tax Paid | Tax Assessment Tax Assessment Total Assessment is a certain percentage of the fair market value that is determined by local assessors to be the total taxable value of land and additions on the property. | Land | Improvement |
|---|---|---|---|---|
| 2025 | $12,489 | $1,025,904 | $615,544 | $410,360 |
| 2024 | $12,489 | $1,005,789 | $603,475 | $402,314 |
| 2023 | $12,296 | $986,069 | $591,643 | $394,426 |
| 2022 | $12,055 | $966,736 | $580,043 | $386,693 |
| 2021 | $11,838 | $947,781 | $568,670 | $379,111 |
| 2020 | $11,899 | $938,063 | $562,839 | $375,224 |
| 2019 | $11,491 | $919,670 | $551,803 | $367,867 |
| 2018 | $11,103 | $901,638 | $540,984 | $360,654 |
| 2017 | $10,672 | $883,960 | $530,377 | $353,583 |
| 2016 | $10,489 | $866,628 | $519,978 | $346,650 |
| 2015 | $10,357 | $853,611 | $512,168 | $341,443 |
| 2014 | $10,084 | $836,891 | $502,136 | $334,755 |
Source: Public Records
Map
Nearby Homes
- 108 Cortland Ave
- 252 Coleridge St
- 15 Heyman Ave
- 255 Bocana St
- 249 Bocana St
- 166 Bonview St
- 1655 Dolores St
- 1817 Church St
- 3755-3759 Mission St
- 55-57 Valley St
- 55 Valley St
- 55 Valley St Unit 57
- 1840 Church St Unit 1842
- 314 Park St
- 111 Richland Ave
- 225 Moultrie St
- 363 Park St
- 125 Leese St
- 266-268 Arlington St
- 31-31A Coleridge St
- 76 Cortland Ave
- 70 Cortland Ave
- 80 Cortland Ave
- 71 Santa Marina St
- 66 Cortland Ave
- 75 Santa Marina St
- 65 Santa Marina St
- 63 Santa Marina St
- 79 Santa Marina St
- 59 Santa Marina St
- 81 Santa Marina St
- 83 Santa Marina St
- 55 Santa Marina St
- 65 Cortland Ave Unit 69
- 71 Cortland Ave Unit 73
- 77 Cortland Ave Unit 79
- 98 Cortland Ave
- 51 Santa Marina St
- 85 Cortland Ave
- 87 Cortland Ave