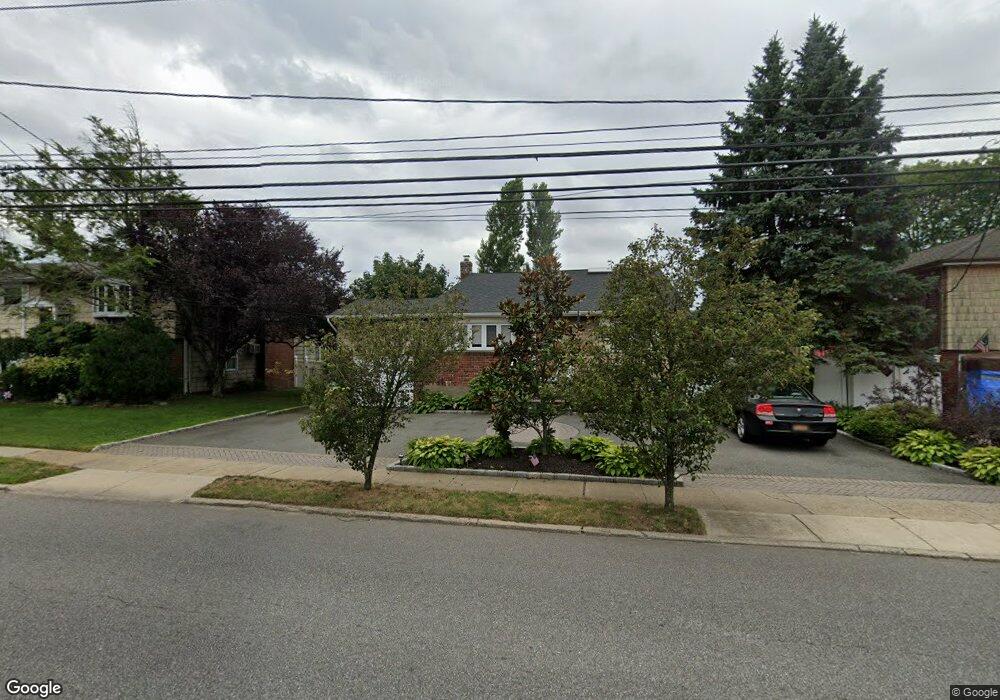
72 Linden St Massapequa Park, NY 11762
Estimated Value: $706,000 - $737,355
4
Beds
3
Baths
6,500
Sq Ft
$111/Sq Ft
Est. Value
About This Home
This home is located at 72 Linden St, Massapequa Park, NY 11762 and is currently estimated at $721,678, approximately $111 per square foot. 72 Linden St is a home located in Nassau County with nearby schools including Albany Avenue Elementary School, Weldon E. Howitt Middle School, and Farmingdale Senior High School.
Ownership History
Date
Name
Owned For
Owner Type
Purchase Details
Closed on
Mar 31, 2016
Sold by
Nagle Tracy
Bought by
Auriemmo Anthony and Auriemmo Jennifer
Current Estimated Value
Home Financials for this Owner
Home Financials are based on the most recent Mortgage that was taken out on this home.
Original Mortgage
$338,000
Outstanding Balance
$268,167
Interest Rate
3.64%
Mortgage Type
New Conventional
Estimated Equity
$453,511
Purchase Details
Closed on
Feb 25, 2004
Sold by
Duggan Charles
Bought by
Reichert Michael
Purchase Details
Closed on
Feb 2, 2003
Sold by
Colgan Thomas
Bought by
Duggan Charles
Create a Home Valuation Report for This Property
The Home Valuation Report is an in-depth analysis detailing your home's value as well as a comparison with similar homes in the area
Home Values in the Area
Average Home Value in this Area
Purchase History
| Date | Buyer | Sale Price | Title Company |
|---|---|---|---|
| Auriemmo Anthony | $408,000 | Fidelity National Title Insu | |
| Reichert Michael | $345,000 | -- | |
| Duggan Charles | $329,000 | -- |
Source: Public Records
Mortgage History
| Date | Status | Borrower | Loan Amount |
|---|---|---|---|
| Open | Auriemmo Anthony | $338,000 |
Source: Public Records
Tax History Compared to Growth
Tax History
| Year | Tax Paid | Tax Assessment Tax Assessment Total Assessment is a certain percentage of the fair market value that is determined by local assessors to be the total taxable value of land and additions on the property. | Land | Improvement |
|---|---|---|---|---|
| 2025 | $11,896 | $441 | $187 | $254 |
| 2024 | $3,129 | $458 | $194 | $264 |
| 2023 | $12,332 | $479 | $203 | $276 |
| 2022 | $12,332 | $479 | $203 | $276 |
| 2021 | $12,154 | $462 | $196 | $266 |
| 2020 | $11,809 | $634 | $633 | $1 |
| 2019 | $11,190 | $612 | $461 | $151 |
| 2018 | $10,182 | $873 | $0 | $0 |
| 2017 | $8,211 | $873 | $658 | $215 |
| 2016 | $11,547 | $873 | $658 | $215 |
| 2015 | $2,947 | $873 | $658 | $215 |
| 2014 | $2,947 | $873 | $658 | $215 |
| 2013 | $2,758 | $873 | $658 | $215 |
Source: Public Records
Map
Nearby Homes