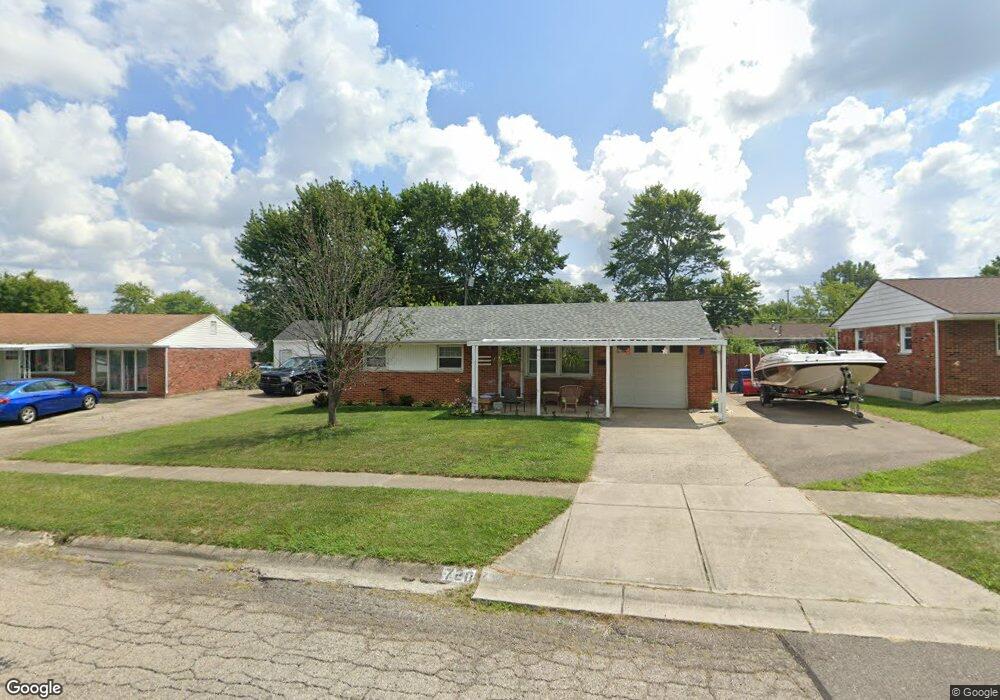
720 Harlan Place Dayton, OH 45431
Estimated Value: $166,000 - $199,000
3
Beds
1
Bath
972
Sq Ft
$184/Sq Ft
Est. Value
About This Home
This home is located at 720 Harlan Place, Dayton, OH 45431 and is currently estimated at $179,272, approximately $184 per square foot. 720 Harlan Place is a home located in Montgomery County with nearby schools including Stebbins High School, St. Helen Elementary School, and East Dayton Christian School.
Ownership History
Date
Name
Owned For
Owner Type
Purchase Details
Closed on
Feb 28, 2006
Sold by
Kuhn Dennis and Kuhn Dennis R
Bought by
Difrederico Dorothy M
Current Estimated Value
Home Financials for this Owner
Home Financials are based on the most recent Mortgage that was taken out on this home.
Original Mortgage
$3,500
Outstanding Balance
$1,997
Interest Rate
6.33%
Mortgage Type
Stand Alone Second
Estimated Equity
$177,275
Purchase Details
Closed on
Feb 12, 1998
Sold by
Shock Anna Marie
Bought by
Kuhn Dennis
Home Financials for this Owner
Home Financials are based on the most recent Mortgage that was taken out on this home.
Original Mortgage
$74,575
Interest Rate
7.23%
Purchase Details
Closed on
Feb 10, 1998
Sold by
Anello Gregory John and Anello Greg
Bought by
Kuhn Dennis
Home Financials for this Owner
Home Financials are based on the most recent Mortgage that was taken out on this home.
Original Mortgage
$74,575
Interest Rate
7.23%
Create a Home Valuation Report for This Property
The Home Valuation Report is an in-depth analysis detailing your home's value as well as a comparison with similar homes in the area
Home Values in the Area
Average Home Value in this Area
Purchase History
| Date | Buyer | Sale Price | Title Company |
|---|---|---|---|
| Difrederico Dorothy M | $87,500 | None Available | |
| Kuhn Dennis | -- | -- | |
| Kuhn Dennis | -- | -- | |
| Kuhn Dennis | -- | -- | |
| Kuhn Dennis | $78,500 | -- | |
| Kuhn Dennis | -- | -- | |
| Kuhn Dennis | $78,500 | -- |
Source: Public Records
Mortgage History
| Date | Status | Borrower | Loan Amount |
|---|---|---|---|
| Open | Difrederico Dorothy M | $3,500 | |
| Open | Difrederico Dorothy M | $86,173 | |
| Previous Owner | Kuhn Dennis | $74,575 |
Source: Public Records
Tax History Compared to Growth
Tax History
| Year | Tax Paid | Tax Assessment Tax Assessment Total Assessment is a certain percentage of the fair market value that is determined by local assessors to be the total taxable value of land and additions on the property. | Land | Improvement |
|---|---|---|---|---|
| 2024 | $2,428 | $50,570 | $8,350 | $42,220 |
| 2023 | $2,428 | $50,570 | $8,350 | $42,220 |
| 2022 | $2,049 | $31,800 | $5,250 | $26,550 |
| 2021 | $2,088 | $31,800 | $5,250 | $26,550 |
| 2020 | $2,087 | $31,800 | $5,250 | $26,550 |
| 2019 | $1,967 | $26,700 | $5,250 | $21,450 |
| 2018 | $1,971 | $26,700 | $5,250 | $21,450 |
| 2017 | $1,971 | $26,700 | $5,250 | $21,450 |
| 2016 | $1,968 | $25,890 | $5,250 | $20,640 |
| 2015 | $2,094 | $25,890 | $5,250 | $20,640 |
| 2014 | $2,094 | $25,890 | $5,250 | $20,640 |
| 2012 | -- | $27,080 | $7,700 | $19,380 |
Source: Public Records
Map
Nearby Homes
- 5300 Duquesne Ave
- 420 Pardee Place
- 4311 Richland Ave
- 4328 Richland Ave
- 5619 Candlelight Ln
- 484 Danforth Place
- 719 Cosler Dr
- 884 Crestmont Dr
- 372 Trunk Dr
- 601 Ostrander Dr
- 511 S Hayden Ave
- 456 S Hayden Ave
- 1921 Emerald Ct
- 5664 Mayville Dr
- 521 Pollock Rd
- Lot 10 Linden Ave
- Lot 11 Linden Ave
- 1815 Huffman Ave
- 1800 Darst Ave
- 5588 Sharp Rd
- 730 Harlan Place
- 710 Harlan Place
- 707 Wagon Wheel Dr
- 695 Wagon Wheel Dr
- 719 Wagon Wheel Dr
- 740 Harlan Place
- 700 Harlan Place
- 685 Wagon Wheel Dr
- 725 Harlan Place
- 735 Harlan Place
- 671 Wagon Wheel Dr
- 750 Harlan Place
- 710 Granville Place
- 690 Harlan Place
- 739 Wagon Wheel Dr
- 667 Wagon Wheel Dr
- 745 Harlan Place
- 708 Wagon Wheel Dr
- 718 Wagon Wheel Dr
- 5144 Mundy Ct